Exam 18: Simple Linear Regression and Correlation
Exam 1: What Is Statistics14 Questions
Exam 2: Types of Data, Data Collection and Sampling16 Questions
Exam 3: Graphical Descriptive Methods Nominal Data19 Questions
Exam 4: Graphical Descriptive Techniques Numerical Data64 Questions
Exam 5: Numerical Descriptive Measures147 Questions
Exam 6: Probability106 Questions
Exam 7: Random Variables and Discrete Probability Distributions55 Questions
Exam 8: Continuous Probability Distributions117 Questions
Exam 9: Statistical Inference: Introduction8 Questions
Exam 10: Sampling Distributions65 Questions
Exam 11: Estimation: Describing a Single Population127 Questions
Exam 12: Estimation: Comparing Two Populations22 Questions
Exam 13: Hypothesis Testing: Describing a Single Population129 Questions
Exam 14: Hypothesis Testing: Comparing Two Populations78 Questions
Exam 15: Inference About Population Variances49 Questions
Exam 16: Analysis of Variance115 Questions
Exam 17: Additional Tests for Nominal Data: Chi-Squared Tests110 Questions
Exam 18: Simple Linear Regression and Correlation213 Questions
Exam 19: Multiple Regression121 Questions
Exam 20: Model Building92 Questions
Exam 21: Nonparametric Techniques126 Questions
Exam 22: Statistical Inference: Conclusion103 Questions
Exam 23: Time-Series Analysis and Forecasting145 Questions
Exam 24: Index Numbers25 Questions
Exam 25: Decision Analysis51 Questions
Select questions type
The standard error of the estimate is the standard deviation of the error variable.
(True/False)
4.8/5  (35)
(35)
The manager of a fast food restaurant wants to determine how sales in a given week are related to the number of discount vouchers (#) printed in the local newspaper during the week. The number of vouchers and sales ($000s) from 10 randomly selected weeks is given below with Excel regression output. Number of vo uchers Sales 4 12.8 7 15.4 5 13.9 3 11.2 19 18.7 10 17.9 8 16.8 6 15.9 3 11.5 5 13.9 Use the regression equation to determine the predicted sales for number of vouchers in the sample,
given, Estimated Sales = 11.5676 + 0.4618.Vouchers
(Essay)
4.8/5 (35)
A financier whose specialty is investing in movie productions has observed that, in general, movies with 'big-name' stars seem to generate more revenue than those movies whose stars are less well known. To examine his belief, he records the gross revenue and the payment (in $ million) given to the two highest-paid performers in the movie for 10 recently released movies. Movie Cost of two highest- paid performers (\ ) Gross revenue (\ ) 1 5.3 48 2 7.2 65 3 1.3 18 4 1.8 20 5 3.5 31 6 2.6 26 7 8.0 73 8 2.4 23 9 4.5 39 10 6.7 58 Draw a scatter diagram of the data to determine whether a linear model appears to be appropriate.
(Essay)
4.9/5 (38)
An ardent fan of television game shows has observed that, in general, the more educated the contestant, the less money he or she wins. To test her belief, she gathers data about the last eight winners of her favourite game show. She records their winnings in dollars and their years of education. The results are as follows. Contestant Years of education Winnings 1 11 750 2 15 400 3 12 600 4 16 350 5 11 800 6 16 300 7 13 650 8 14 400 Use the predicted and actual values of y to calculate the residuals.
(Essay)
4.7/5 (33)
A professor of economics wants to study the relationship between income y (in $1000s) and education x (in years). A random sample of eight individuals is taken and the results are shown below. Education 16 11 15 8 12 10 13 14 Income 58 40 55 35 43 41 52 49 Determine the standard error of estimate, and describe what this statistic tells you about the regression line.
(Essay)
4.9/5 (33)
If there is no linear relationship between two variables and , the coefficient of correclation will be zero.
(True/False)
4.8/5 (32)
In a regression problem the following pairs (x,y) are given: (1,2), (2.5,2), (3,2), (5,2) and (5.3,2). This indicates that the:
(Multiple Choice)
4.9/5 (31)
If an estimated regression line has a y-intercept of 10 and a slope of -5, then when x = 0, the estimated value of y is:
(Multiple Choice)
4.8/5 (44)
The manager of a fast food restaurant wants to determine how sales in a given week are related to the number of discount vouchers (#) printed in the local newspaper during the week. The number of vouchers and sales ($000s) from 10 randomly selected weeks is given below with Excel regression output. 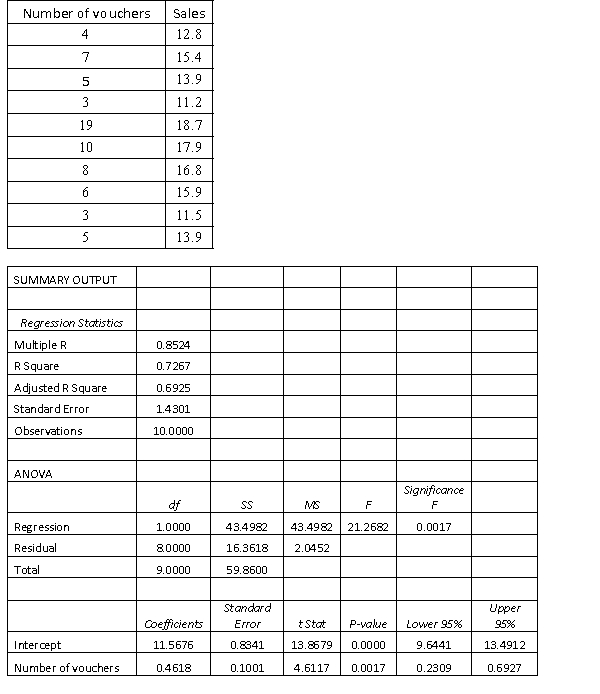 Interpret the coefficient of correlation.
(Essay)
4.8/5 (35)
The probability distribution of the error variable is supposed to be normal, with mean E( ) = 0 and constant standard deviation .
(True/False)
4.8/5 (31)
Plot the residuals against the predicted values of y. Does the variance appear to be constant?
(Essay)
4.9/5 (36)
An ardent fan of television game shows has observed that, in general, the more educated the contestant, the less money he or she wins. To test her belief, she gathers data about the last eight winners of her favourite game show. She records their winnings in dollars and their years of education. The results are as follows. Contestant Years of education Winnings 1 11 750 2 15 400 3 12 600 4 16 350 5 11 800 6 16 300 7 13 650 8 14 400 Predict with 95% confidence the winnings of a contestant who has 15 years of education.
(Essay)
4.8/5 (33)
A professor of economics wants to study the relationship between income y (in $1000s) and education x (in years). A random sample of eight individuals is taken and the results are shown below. Education 16 11 15 8 12 10 13 14 Income 58 40 55 35 43 41 52 49 Use the regression equation to determine the predicted values of y.
(Essay)
4.8/5 (42)
A regression analysis between sales (in $1000) and advertising (in $100) yielded the least squares line  = 75 +6x. This implies that if $800 is spent on advertising, then the predicted amount of sales (in dollars) is:
(Multiple Choice)
4.8/5 (32)
A professor of economics wants to study the relationship between income y (in $1000s) and education x (in years). A random sample of eight individuals is taken and the results are shown below. Education 16 11 15 8 12 10 13 14 Income 58 40 55 35 43 41 52 49 Draw a scatter diagram of the data to determine whether a linear model appears to be appropriate.
(Essay)
4.8/5 (29)
An ardent fan of television game shows has observed that, in general, the more educated the contestant, the less money he or she wins. To test her belief, she gathers data about the last eight winners of her favourite game show. She records their winnings in dollars and their years of education. The results are as follows. Contestant Years of education Winnings 1 11 750 2 15 400 3 12 600 4 16 350 5 11 800 6 16 300 7 13 650 8 14 400 Determine the coefficient of determination and discuss what its value tells you about the two variables.
(Essay)
4.8/5 (34)
An ardent fan of television game shows has observed that, in general, the more educated the contestant, the less money he or she wins. To test her belief, she gathers data about the last eight winners of her favourite game show. She records their winnings in dollars and their years of education. The results are as follows. Contestant Years of education Winnings 1 11 750 2 15 400 3 12 600 4 16 350 5 11 800 6 16 300 7 13 650 8 14 400 Predict with 95% the winnings of all contestants who have 15 years of education.
(Essay)
4.9/5 (33)
A consultant for a beer company wanted to determine whether those who drink a lot of beer actually enjoy the taste more than those who drink moderately or rarely. She took a random sample of eight men and asked each how many beers they typically drink per week. She also asked them to rate their favourite brand of beer on a 10-point scale (1 = bad, 10 = excellent). The results are shown below. Can we infer at the 5% significance level that frequent beer drinkers rate their favourite beer more highly than less frequent drinkers? Beer drinker Typical weekly consumption Rating 1 4 6 2 3 6 3 12 9 4 15 8 5 7 8 6 9 6 7 1 5 8 10 8
(Essay)
4.8/5 (41)
Regardless of the value of x, the standard deviation of the distribution of y values about the regression line is supposed to be constant. This assumption of equal standard deviations about the regression line is called multicollinearity.
(True/False)
4.8/5 (41)
Filters
- Essay(0)
- Multiple Choice(0)
- Short Answer(0)
- True False(0)
- Matching(0)