Exam 3: Graphical Methods for Describing Data
Exam 1: The Role of Statistics and the Data Analysis Process17 Questions
Exam 2: Collecting Data Sensibly39 Questions
Exam 3: Graphical Methods for Describing Data25 Questions
Exam 4: Numerical Methods for Describing Data26 Questions
Exam 5: Summarizing Bivariate Data37 Questions
Exam 6: Probability34 Questions
Exam 7: Random Variables and Probability Distributions45 Questions
Exam 8: Sampling Variability and Sampling Distributions27 Questions
Exam 9: Estimation Using a Single Sample46 Questions
Exam 10: Hypothesis Testing Using a Single Sample37 Questions
Exam 11: Comparing Two Populations or Treatments42 Questions
Exam 12: The Analysis of Categorical Data and Goodness-Of-Fit Tests21 Questions
Exam 13: Simple Linear Regression and Correlation: Inferential Methods56 Questions
Exam 14: Multiple Regression Analysis38 Questions
Exam 15: Analysis of Variance40 Questions
Exam 16: Nonparametric Distribution-Free Statistical Methods15 Questions
Select questions type
The quantity  often gives a rough estimate of the appropriate number of intervals in a histogram.
(True/False)
4.8/5  (37)
(37)
Would you say that most lawyers in this country are really interested in the public good, or are most lawyers just out to make a lot of money? The following table summarizes the responses to the lawyer question when these questions were asked in different orders. 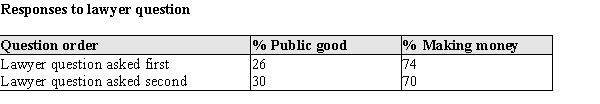 (a) Construct a comparative bar chart for these response percentages. (b) Interpret the results of the 1974 survey. Do you think the order of the questions made a difference in the responses? Explain.
(Essay)
4.8/5 (32)
As part of the United States Census, data is also collected on the number of persons in each household. The census data for four decades is summarized below. 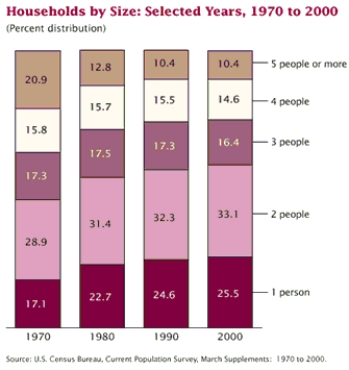 (a) In a few sentences describe how the proportion of households with 4 people has changed from 1970 to 2000. (b) What size of household appears to have decreased the most from 1970 to 2000?
(Essay)
4.8/5 (35)
In a scatter plot, both the horizontal and vertical axes must be set at zero.
(True/False)
4.9/5 (36)
In 1986 marine biologists reported the discovery of a new species of fish in the Western North Atlantic. Data on the head length (n = 41) and pelvic fin length (n = 30) are shown below. 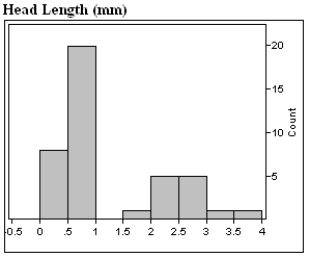
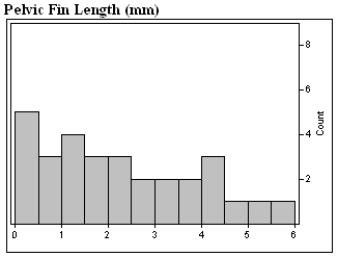 a) Describe in appropriate statistical terms, the distributions of these two variables. b) The distribution of head lengths certainly appears to be rather strange. What do you think might account for the shape of this distribution?
(Essay)
4.8/5 (39)
Filters
- Essay(0)
- Multiple Choice(0)
- Short Answer(0)
- True False(0)
- Matching(0)