Exam 4: Describing Bivariate Numerical Data
Exam 1: Collecting Data in Reasonable Ways56 Questions
Exam 2: Graphical Methods for Describing Data Distributions62 Questions
Exam 3: Numerical Methods for Describing Data Distributions37 Questions
Exam 4: Describing Bivariate Numerical Data70 Questions
Exam 5: Probability55 Questions
Exam 6: Random Variables and Probability Distributions72 Questions
Exam 7: An Overview of Statistical Inference - Learning From Data19 Questions
Exam 8: Sampling Variability and Sampling Distributions35 Questions
Exam 9: Estimating a Population Proportion36 Questions
Exam 10: Asking and Answering Questions About a Population Proportion31 Questions
Exam 11: Asking and Answering Questions About the Difference Between Two Proportions42 Questions
Exam 12: Asking and Answering Questions About a Population Mean51 Questions
Exam 13: Asking and Answering Questions About the Difference Between Two Means46 Questions
Exam 14: Learning From Categorical Data36 Questions
Exam 15: Understanding Relationships - Numerical Data Part 243 Questions
Exam 16: Asking and Answering Questions About More Than Two Means25 Questions
Select questions type
Assessing the goodness of fit of a regression line involves considering different information, and no single characteristic of data is sufficient for a good assessment. Consider the characteristics below. How does each contribute to an assessment of fit? That is, for each piece of information, what about it would indicate a "good" best-fit line?
a)The shape of the scatter plot
b)The correlation coefficient
c)The standard deviation of the residuals
d)The coefficient of determination
(Essay)
4.8/5  (35)
(35)
Exhibit 4-7
Golden-rumped elephant shrews have long flexible snouts, used to overturn leaf-litter where they find their food: millipedes, insects and spiders. These animals are among the approximately 10% of mammalian species that mate for life. Just why these mammals are monogamous is poorly understood, and one theory is that a monogamous male would have to defend less territory from intrusion by other males. The home range of an animal, i.e. that area over which they typically travel, is a function of diet and energy consumption of the animal. The energy consumption is, in turn, typically a function of the animal's size. In a recent study, investigators reasoned that if monogamy was related in some way to the home territory, this should be detectable by comparing these animals to other insect-eating mammals. Data were gathered on 27 similar species and are presented in the table below. 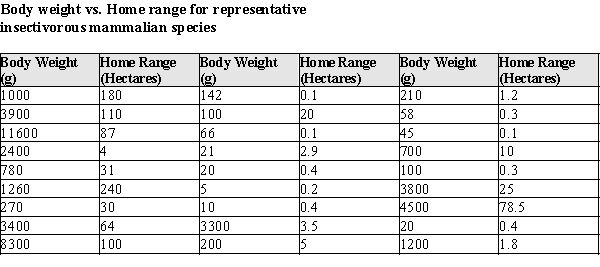 After fitting a straight line model,
  , significant curvature was detected in the residual plot, and two transformed models were chosen for further analysis: the power and exponential models. The computer output for these transformed models and the residual plots follow.
Residual Plot and Statistical Analysis - exponential model
, significant curvature was detected in the residual plot, and two transformed models were chosen for further analysis: the power and exponential models. The computer output for these transformed models and the residual plots follow.
Residual Plot and Statistical Analysis - exponential model 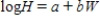
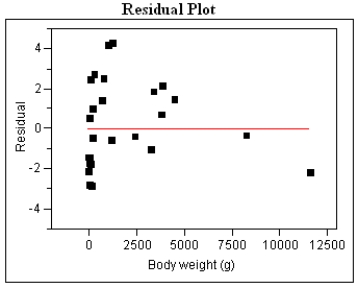 Log Home Range vs. Weight
Log(H) = 0.250 + 0.000231 W
Log Home Range vs. Weight
Log(H) = 0.250 + 0.000231 W  Residual Plot and Statistical Analysis - Power model
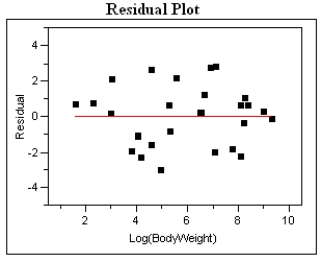 Log Home Range vs. Log Weight
Log(H) = −1.601 + 0.893Log(W)
Log Home Range vs. Log Weight
Log(H) = −1.601 + 0.893Log(W)  -Refer to Exhibit 4-7.
Generally speaking, which of the two models, power or exponential, is better at predicting the log (Home Range)? Provide statistical justification for your choice.
-Refer to Exhibit 4-7.
Generally speaking, which of the two models, power or exponential, is better at predicting the log (Home Range)? Provide statistical justification for your choice.
(Essay)
4.8/5 (32)
The standard deviation about the least squares line is roughly the typical amount by which an observation deviates from the least squares line.
(True/False)
4.9/5 (35)
Exhibit 4-3
Paleontology, the study of forms of prehistoric life, can sometimes be aided by modern biology. The study of prehistoric birds depends on fossil information, which typically consists of imprints in stone of a prehistoric creature's remains. To study the productivity of an ancient ecosystem it would be useful know the actual mass of the individual birds, but this information is not preserved in the fossil record. It seems reasonable that the biomechanics of birds operates much the same today as in the past. For example, relationship between the wing length and total weight of a bird should be very similar today to the relationship in the distant past. The wing lengths of ancient birds are readily obtainable from the fossil record, but the weight is not. Assuming similar biomechanical development for ancient birds and modern birds, a regression model expressing the relationship between wing length and total weight of a modern bird could be used to estimate the mass of similar prehistoric birds and thus gauge some aspects of the ancient ecosystem.
Data is available for some modern birds of prey. Specifically, data on the mean wing length and mean total weight of species of hawk-like birds of prey is given below. 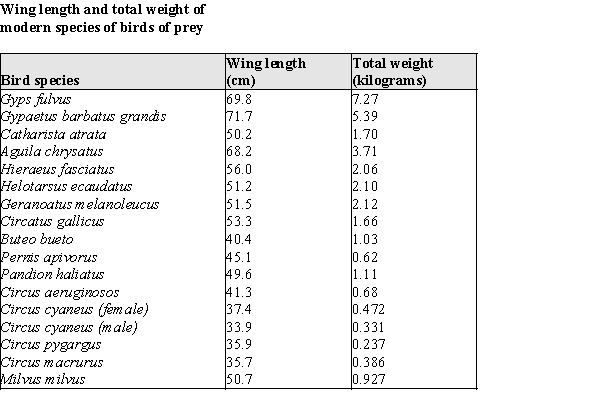 -Refer to Exhibit 4-3. What is the equation of the least-squares line?
(Essay)
4.8/5 (33)
One should get nice enough grades in the high school to enter the University of Alabama. A survey has been conducted among high school graduates who want to be admitted to the University of Alabama revealing their GPA and SAT scores. The results of this survey are presented in the table below. 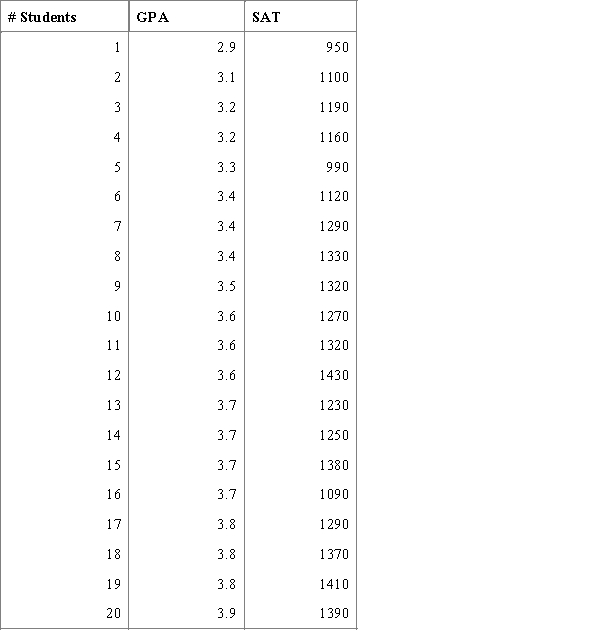 Using this information calculate and interpret the value of the correlation coefficient between GPA and SAT scores of the students.
(Multiple Choice)
4.8/5 (44)
Twenty-five assembly-line workers participated in a study to investigate the relationship between experience and the amount of time required to complete an assembly task. Assembly time (in minutes) and number of months the worker had been employed on the assembly line were measured for each worker. The resulting data on y= time to complete assembly and x= number of months on the assembly line were used to produce the scatterplot and computer output below.
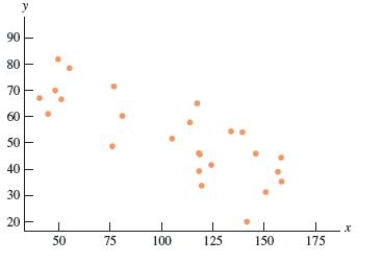
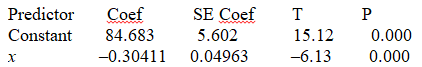 S= 9.79097 R-Sq = 62.0% R-Sq(adj) = 60.4%
Predict the time required to complete the assembly for an employee with 10 months of experience.
S= 9.79097 R-Sq = 62.0% R-Sq(adj) = 60.4%
Predict the time required to complete the assembly for an employee with 10 months of experience.
(Multiple Choice)
4.9/5 (43)
One of the properties of Pearson's r is: "The value of r does not depend on the unit of measurement for either variable." In your own words, what does this mean?
(Essay)
4.8/5 (35)
Exhibit 4-2
The theory of fiber strength suggests that the relationship between fiber tenacity and amino acid ratio is logarithmic, i.e.  , where T is the tenacity and R is the amino acid ratio.
Perform the appropriate transformation of variable(s) and fit this logarithmic model to the data.
, where T is the tenacity and R is the amino acid ratio.
Perform the appropriate transformation of variable(s) and fit this logarithmic model to the data.
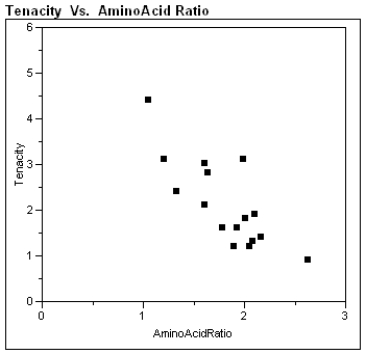 -Refer to Exhibit 4-2.
What is the resulting best fit line using this model?
-Refer to Exhibit 4-2.
What is the resulting best fit line using this model?
(Essay)
4.9/5 (39)
As early as 3 years of age, children begin to show preferences for playing with members of their own sex, and report having more same-sex than opposite-sex friends. In a study of 3rd and 4th graders' views on 48 personality traits, children were asked to rate on a "5-point" scale:
−2
= "someone possessing that trait is probably a boy"
−1
= "someone possessing that trait might be a boy"
0
= "can't tell"
1
= "someone possessing that trait might be a girl"
2
= "someone possessing that trait is probably a girl"
A plot of the data is presented below. A single point represents the (average girls' rating, average boys' rating) for a given trait. 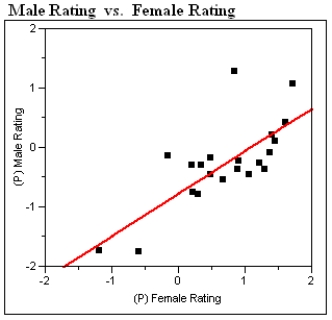 Linear Fit
MRating = −0.765 + 0.714 FRating
Linear Fit
MRating = −0.765 + 0.714 FRating 
a)Circle the single point which represents the most influential observation. What aspect of this point makes it the most influential?
b)Suppose a personality trait similar to those used in the survey were given a 0.0 rating ("can't tell") by the girls. The predicted boys' average rating would be closest to which of the 5 categories described above?
c)The traits plotted above are those the researchers believe are "positive" traits, such as "mature," "honest," and "polite." The researchers thought that girls would rate these positive traits as characteristic of girls to a greater extent than boys would. What aspects of the plot and/or regression analysis presented above are consistent with this thinking?
(Essay)
4.9/5 (37)
According to the information of the Council of graduate schools ( "http://cgsnet.org/cgs-international-graduate-admissions-survey-reports" , the total number of non-U.S. graduates applying for admission to the master's and doctoral degree programs in U.S. colleges and universities has been increasing year-to-year from 2010. 
(Multiple Choice)
4.8/5 (38)
Filters
- Essay(0)
- Multiple Choice(0)
- Short Answer(0)
- True False(0)
- Matching(0)