Exam 4: Describing Bivariate Numerical Data
Exam 1: Collecting Data in Reasonable Ways56 Questions
Exam 2: Graphical Methods for Describing Data Distributions62 Questions
Exam 3: Numerical Methods for Describing Data Distributions37 Questions
Exam 4: Describing Bivariate Numerical Data70 Questions
Exam 5: Probability55 Questions
Exam 6: Random Variables and Probability Distributions72 Questions
Exam 7: An Overview of Statistical Inference - Learning From Data19 Questions
Exam 8: Sampling Variability and Sampling Distributions35 Questions
Exam 9: Estimating a Population Proportion36 Questions
Exam 10: Asking and Answering Questions About a Population Proportion31 Questions
Exam 11: Asking and Answering Questions About the Difference Between Two Proportions42 Questions
Exam 12: Asking and Answering Questions About a Population Mean51 Questions
Exam 13: Asking and Answering Questions About the Difference Between Two Means46 Questions
Exam 14: Learning From Categorical Data36 Questions
Exam 15: Understanding Relationships - Numerical Data Part 243 Questions
Exam 16: Asking and Answering Questions About More Than Two Means25 Questions
Select questions type
One of the problems when estimating the size of animal populations from aerial surveys is that animals may bunch together, making it difficult to distinguish and count them accurately. For example, a horse standing alone is easy to spot; if seven horses huddled close together some may be missed, resulting in an undercount. The relative frequency of undercounts is typically reported as a percent. For example, if there are 10 horses in a group, a person in the plane may typically count fewer than 10 horses 20% of the time. In a recent study, the percent of sightings that resulted in an undercount was related to the size of the "group" of horses and donkeys; the following data were gathered: 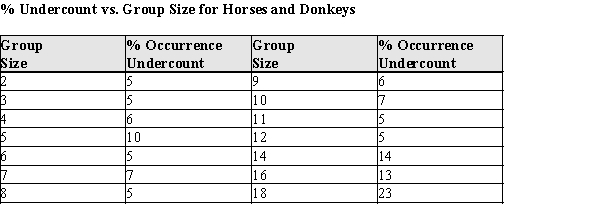 After fitting a straight line model,
  , significant curvature was detected in the residual plot, and two nonlinear models were chosen for further analysis, the exponential and the power models. The computer output for these models is given below, and the residual plots follow.
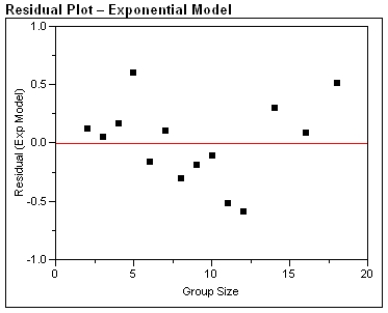
 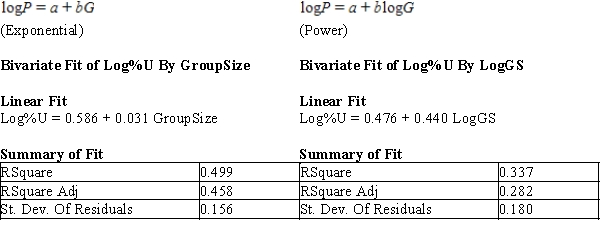 Residual Plots
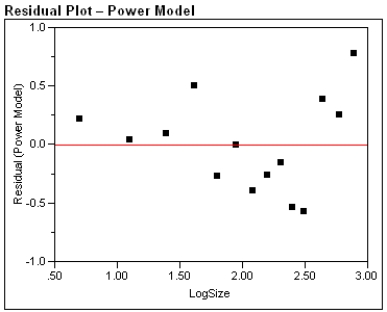 a)For the exponential model, calculate the predicted log (%undercount) for a group size = 10.
b)Use your calculations from part (a) to predict the %undercount for a group size = 10.
c)Generally speaking, which of the two models, power or exponential, is better at predicting the log (Percent Undercount)? Provide statistical justification for your choice.
a)For the exponential model, calculate the predicted log (%undercount) for a group size = 10.
b)Use your calculations from part (a) to predict the %undercount for a group size = 10.
c)Generally speaking, which of the two models, power or exponential, is better at predicting the log (Percent Undercount)? Provide statistical justification for your choice.
(Essay)
5.0/5  (32)
(32)
We know that the linear regression must be used if we have a strong relationship between  and
and  (or in other words when
  is proportional to
  ). Choose the statement that best describes the values of
  and
and  which indicate the fact that the relationship is very strong.
(Multiple Choice)
5.0/5 (35)
The plot given below shows the points and the regression lines for the data set on the same graph. The blue line is the regression line for all points. The red line is the regression line for the data points excluding those which influence observation. 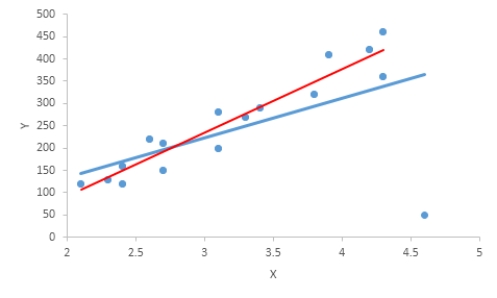 Describe the effect of the influential observation on the equation of the least squares regression line. Select the correct statement.
(Multiple Choice)
4.9/5 (36)
The higher the value of the coefficient of determination, the greater the evidence for a causal relationship between x and y.
(True/False)
4.8/5 (44)
A common statistical method for estimating a population size assumes each member of the population has an equal probability of being captured. To assess this assumption for crocodile populations, investigators repeatedly sampled sections of rivers in Australia. Crocodile lengths were measured in size classes. Crocs 0.0 - 0.3 meters in length are in size class 1, 0.3 - 0.6 meters in length are size class 2, etc. The normal maximum adult length is in a class size of 9 or 10. The investigators fit a quadratic function relating the probability of capture and the size class of captured crocodiles. The output from their analysis is shown below. 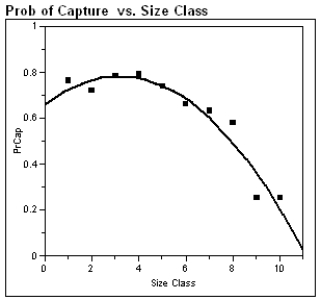 Polynomial Fit Degree=2
PrCap = 0.66 + 0.77Class − 0.01(Class)^2
Polynomial Fit Degree=2
PrCap = 0.66 + 0.77Class − 0.01(Class)^2 
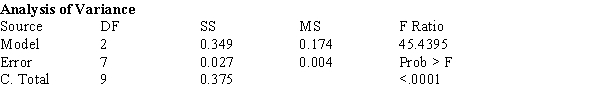
(a)What proportion of the variability in probability of capture is explained by the crocodile's size class?
(b)Some biologists speculate that as crocodiles grow they become more wary of humans, and are more difficult to detect in the wild. Support or refute this belief by appealing to the analysis above.
(Essay)
4.9/5 (39)
The breeding success of birds that nest on the ground can be affected by the depth of winter snow in high altitudes. The plot below relates the percentage of White-tailed Ptarmigan hens hatching at least one egg, to the amount of snowfall in the Sierra Nevadas that winter. 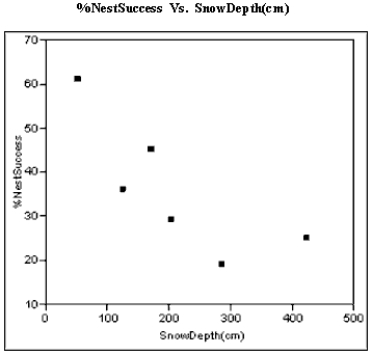 a)The least squares best fit line is %NestSuccess = 55.1816 − 0.092(SnowDepth). Graph this line using the axes above. Show any calculations in the space below.
b)The least squares line is the line that minimizes the sum of the squared residuals. On the graph above pick 2 points and sketch the residuals associated with those points.
a)The least squares best fit line is %NestSuccess = 55.1816 − 0.092(SnowDepth). Graph this line using the axes above. Show any calculations in the space below.
b)The least squares line is the line that minimizes the sum of the squared residuals. On the graph above pick 2 points and sketch the residuals associated with those points.
(Essay)
4.8/5 (35)
Exhibit 4-1
The preservation of objects made of organic material is a constant concern to those caring for items of historical interest. For example, some delicate fabrics are natural silks--they are made of protein and are biodegradable. Many silks in museum collections are in danger of crumbling. It would be of great benefit to be able to assess the delicacy of the fabric before making decisions about displaying it. One possibility is chemical analysis, which might give some evidence about the brittle nature of a fabric. To investigate this possibility, bio-chemical data in the form of a ratio of the amount of certain amino acids in the fibers was acquired from the linings of sixteen 19th and early 20th century Japanese kimonos, and the tenacity (breaking stress) of the fabric was also recorded.
Using the data from the Japanese kimonos, construct the least squares best fit line predicting tenacity using amino acid ratio as a predictor. 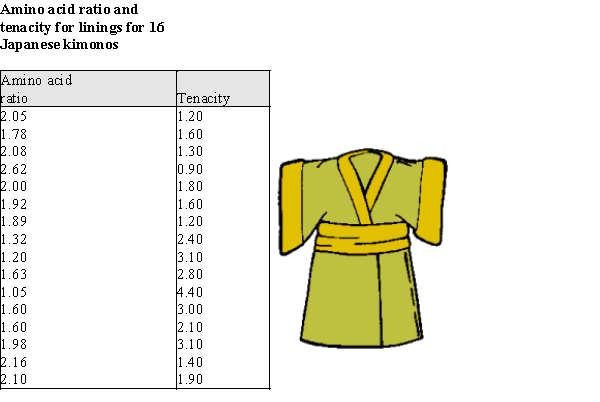 -Refer to Exhibit 4-1.
What is the equation of the least-squares line?
-Refer to Exhibit 4-1.
What is the equation of the least-squares line?
(Essay)
4.9/5 (39)
The Des Moines Register recently reported the ratings of high school sportsmanship as compiled by the Iowa High School Athletic Association. For each school the spectators and participants were rated by referees, where 1 = superior, and 5 = unsatisfactory. A regression analysis of the average scores given to wrestling spectators and wrestlers is shown below. 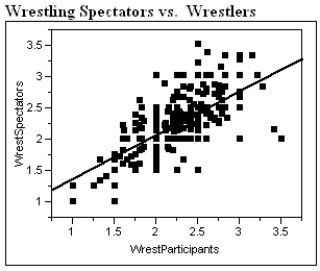 Linear Fit
WrestSpectators = 0.667 + 0.701 Wrestlers
Linear Fit
WrestSpectators = 0.667 + 0.701 Wrestlers 
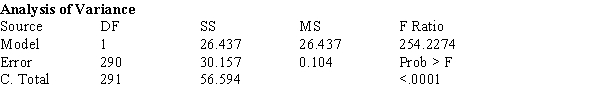
a)Interpret the correlation between the ratings of spectators and wrestlers.
b)Interpret the coefficient of determination.
c)Interpret the value of the standard deviation about the least squares line.
a)Interpret the correlation between the ratings of spectators and wrestlers.
b)Interpret the coefficient of determination.
c)Interpret the value of the standard deviation about the least squares line.
(Essay)
4.8/5 (37)
Suppose that the locally minted coins analyzed in Exhibit 4-5 are representative of the metallurgical content of mints in the Eastern provinces of the Roman Empire during the first 300 years AD.
a)If a locally minted coin is selected at random, and it's gold content is 0.30% by weight, calculate the predicted lead content. Be sure to use correct notation and units.
b)One of the coins used to calculate the regression equations has a gold content of 0.300%. Calculate the residual for this coin. Be sure to use correct notation and units.
c)The investigators would like to use the regression equation to help assess whether a coin is locally minted or minted in Rome. In a few sentences, describe how the regression equation could be used for this purpose. (Hint: In order to use the equation for this purpose, how would coins minted in Rome have to differ from locally minted coins?)
(Essay)
4.7/5 (36)
One of the properties of Pearson's r is: "The value of r does not depend on which of the two variables is labeled as x." In your own words, what does this mean?
(Essay)
4.8/5 (35)
To confirm Ohm's law, the student measures the voltage versus current for the conductor sample. The student changes the current through the conductor from 0 to 2 mA every 20 seconds increasing the current by 0.2 mA and measures the corresponding voltage value. The results of these measurements are presented in the table below. 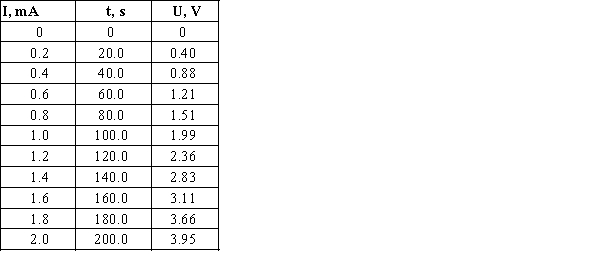 Find the correlation coefficients for the obtained data and make your conclusions about thestatistical relationships between current and voltage and between time and voltage. Can we conclude that correlations imply causation for these pairs of variables?
(Multiple Choice)
4.9/5 (44)
Exhibit 4-7
Golden-rumped elephant shrews have long flexible snouts, used to overturn leaf-litter where they find their food: millipedes, insects and spiders. These animals are among the approximately 10% of mammalian species that mate for life. Just why these mammals are monogamous is poorly understood, and one theory is that a monogamous male would have to defend less territory from intrusion by other males. The home range of an animal, i.e. that area over which they typically travel, is a function of diet and energy consumption of the animal. The energy consumption is, in turn, typically a function of the animal's size. In a recent study, investigators reasoned that if monogamy was related in some way to the home territory, this should be detectable by comparing these animals to other insect-eating mammals. Data were gathered on 27 similar species and are presented in the table below. 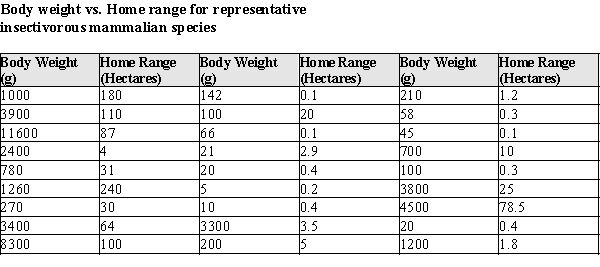 After fitting a straight line model,
  , significant curvature was detected in the residual plot, and two transformed models were chosen for further analysis: the power and exponential models. The computer output for these transformed models and the residual plots follow.
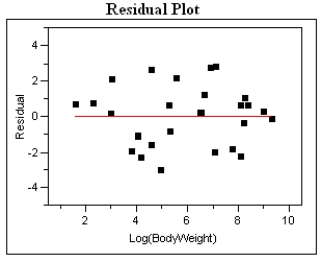
Residual Plot and Statistical Analysis - exponential model
, significant curvature was detected in the residual plot, and two transformed models were chosen for further analysis: the power and exponential models. The computer output for these transformed models and the residual plots follow.
Residual Plot and Statistical Analysis - exponential model 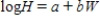
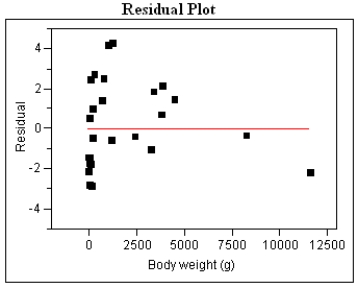 Log Home Range vs. Weight
Log(H) = 0.250 + 0.000231 W
Log Home Range vs. Weight
Log(H) = 0.250 + 0.000231 W  Residual Plot and Statistical Analysis - Power model
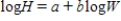
 Log Home Range vs. Log Weight
Log(H) = −1.601 + 0.893Log(W)
Log Home Range vs. Log Weight
Log(H) = −1.601 + 0.893Log(W)  -Refer to Exhibit 4-7.
For the exponential model, calculate the predicted log (Home Range) for a Weight of 1000g.
-Refer to Exhibit 4-7.
For the exponential model, calculate the predicted log (Home Range) for a Weight of 1000g.
(Essay)
5.0/5 (35)
If a scatter plot exhibits a strong positive relationship, what can be said about the value of the quantity,  ?
?
(Short Answer)
4.8/5 (30)
The coefficient of determination is equal to the positive square root of Pearson's r.
(True/False)
4.9/5 (34)
The slope of the least squares line is the average amount by which y increases as x increases by one unit.
(True/False)
4.9/5 (39)
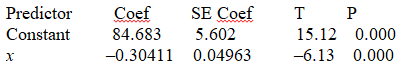
Twenty-five assembly-line workers participated in a study to investigate the relationship between experience and the amount of time required to complete an assembly task. Assembly time (in minutes) and number of months the worker had been employed on the assembly line were measured for each worker. The resulting data on y = time to complete assembly and x = number of months on the assembly line were used to produce the scatterplot and computer output below. 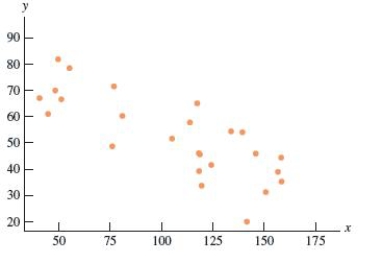
 S = 9.79097 R-Sq = 62.0% R-Sq(adj) = 60.4%
Which of the following is the value of the intercept of the least squares regression line?
S = 9.79097 R-Sq = 62.0% R-Sq(adj) = 60.4%
Which of the following is the value of the intercept of the least squares regression line?
(Multiple Choice)
4.9/5 (35)
Suppose that the coins analyzed in Exhibit 4-6 are representative of the metallurgical content of coins minted in Rome during the first 300 years AD.
a)If a Roman coin is selected at random, and its gold content is 0.20% by weight, calculate the predicted lead content. Be sure to use correct notation and units.
b)One of the coins used to calculate the regression equations has a gold content of 0.200%. Calculate the residual for this coin. Be sure to use correct notation and units.
c)The investigators would like to use the regression equation to help assess whether a coin is locally minted or minted in Rome. In a few sentences, describe how the regression equation could be used for this purpose. (Hint: In order to use the equation for this purpose, how would coins minted in local mints in the Eastern Provinces have to differ from Roman coins?)
(Essay)
4.9/5 (41)
The model W = a + bL cannot be directly compared to a model with a response variable logW using the correlation or the standard error of the residuals, because the scales differ. How would you evaluate your transformed model in Exhibit 4-4 to see if it is an improvement over the linear model?
(Essay)
4.8/5 (42)
Polar bear cubs are born in the winter in dens, and they must live off the fat stores of the mother even after leaving the den for sea ice, since the availability of their prey is unpredictable. Therefore, maternal weight is an important factor in successful reproduction of polar bears. In a recent spring, 261 adult females with 492 cubs were captured as they left their dens, and the mothers' weight and ages were determined by "counting annuli in the cementum of an extracted vestigial premolar tooth." (We are NOT making this up!) A quadratic fit of the maternal weight in kilograms to age in years resulted in the regression analysis below. 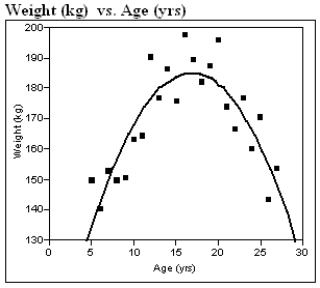 Polynomial Fit Degree=2
Weight = 82.920 + 12.134 Age − 0.360(Age )^2
Polynomial Fit Degree=2
Weight = 82.920 + 12.134 Age − 0.360(Age )^2 
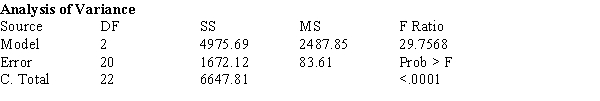
a)On average, about how far off are the weights of the maternal bears? That is, what is a typical difference between the actual weights and the weights predicted by the quadratic model?
b)If the maternal weight is an important factor as discussed above, what age of the female would seem to be the best for reproduction success? In a few sentences, justify your answer by appealing to the information provided above.
(Essay)
4.8/5 (39)
Filters
- Essay(0)
- Multiple Choice(0)
- Short Answer(0)
- True False(0)
- Matching(0)