Exam 4: Describing Bivariate Numerical Data
Exam 1: Collecting Data in Reasonable Ways56 Questions
Exam 2: Graphical Methods for Describing Data Distributions62 Questions
Exam 3: Numerical Methods for Describing Data Distributions37 Questions
Exam 4: Describing Bivariate Numerical Data70 Questions
Exam 5: Probability55 Questions
Exam 6: Random Variables and Probability Distributions72 Questions
Exam 7: An Overview of Statistical Inference - Learning From Data19 Questions
Exam 8: Sampling Variability and Sampling Distributions35 Questions
Exam 9: Estimating a Population Proportion36 Questions
Exam 10: Asking and Answering Questions About a Population Proportion31 Questions
Exam 11: Asking and Answering Questions About the Difference Between Two Proportions42 Questions
Exam 12: Asking and Answering Questions About a Population Mean51 Questions
Exam 13: Asking and Answering Questions About the Difference Between Two Means46 Questions
Exam 14: Learning From Categorical Data36 Questions
Exam 15: Understanding Relationships - Numerical Data Part 243 Questions
Exam 16: Asking and Answering Questions About More Than Two Means25 Questions
Select questions type
According to the Hooke's Law the force (  ) needed to extend or compress a spring by some distance scales linearly with respect to that distance. Student measures the force exerted on the spring versus spring extension. The results of student's measurements are presented in the table below.
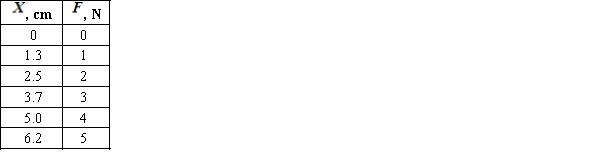
Student observed that the values have the correlation coefficient close to 1, and filled in the table for the values
Student observed that the values have the correlation coefficient close to 1, and filled in the table for the values  , 7,and 8 newtons. However, the professor noticed the deception, drawing attention to the fact that the student could not get such value of extension for the force of 8 newtons. Calculate the predicted value for 8 N and explain why this value can be incorrect.
(Multiple Choice)
4.7/5  (39)
(39)
For the given scatterplot, identify if there is a relationship between  and
and  . If there is a relationship between the variables, define, if it is linear or nonlinear. If the relationship appears to be linear, determine the direction and the strength of this relationship.
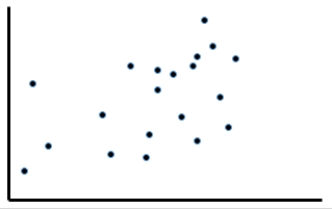
(Multiple Choice)
4.7/5 (34)
Pearson's correlation coefficient, r, does not depend on the units of measurement of the two variables.
(True/False)
4.8/5 (37)
For the given scatterplot, identify if there is a relationship between  and
and  . If there is a relationship between the variables, define, if it is linear or nonlinear. If the relationship appears to be linear, determine the direction and the strength of this relationship.
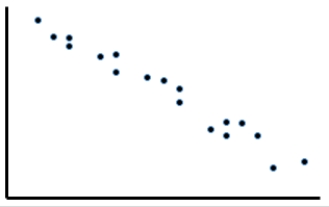
(Multiple Choice)
4.8/5 (46)
Exhibit 4-6
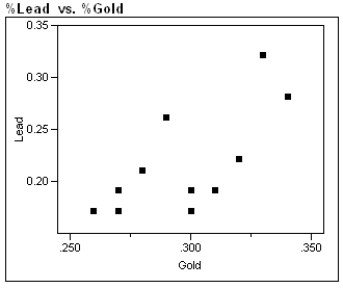
During the first 3 centuries AD, the Roman Empire produced coins in the Eastern provinces. Some historians argue that not all these coins were produced in Roman mints, and further that local provincial mints struck some of them. Because the "style" of coins is difficult to analyze, the historians would like to use metallurgical analysis as one tool to identify the source mints of these coins. Investigators studied 8 coins known to have been produced by the mint in Rome in an attempt to identify a trace element profile for these coins, and have identified gold and lead as possible factors in identifying other coins as having been minted in Rome. The gold and lead content, measured as a % of weight of each coin, is given in the table, and a scatter plot of these data is presented below. 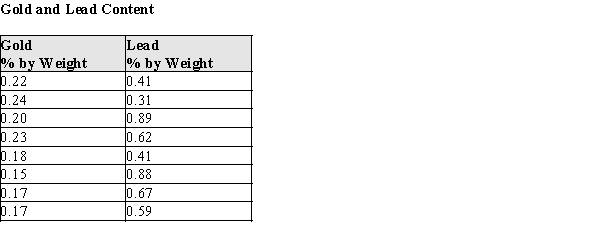
 -Refer to Exhibit 4-6.
a)What is the equation of the least squares best fit line?
b)Sketch the best fit line on the scatter plot.
c)What is the value of the correlation coefficient? Interpret this value.
d)What is the value of the coefficient of determination? Give an interpretation of this value.
-Refer to Exhibit 4-6.
a)What is the equation of the least squares best fit line?
b)Sketch the best fit line on the scatter plot.
c)What is the value of the correlation coefficient? Interpret this value.
d)What is the value of the coefficient of determination? Give an interpretation of this value.
(Essay)
4.7/5 (42)
Which of the following indicates the range of possible values of the coefficient of determination,  ?
?
(Multiple Choice)
4.8/5 (33)
If r is close to 1, then the points lie close to a straight line with a positive slope.
(True/False)
4.8/5 (35)
Data on x = the weight of a pickup truck (pounds) and y = distance (in feet) required for a truck traveling 40 miles per hour to come to a complete stop for 30 trucks was used to fit the least squares regression line  . Which of the following statements is a correct interpretation of the value 26 in the equation of the regression line?
(Multiple Choice)
4.8/5 (35)
Exhibit 4-2
The theory of fiber strength suggests that the relationship between fiber tenacity and amino acid ratio is logarithmic, i.e. 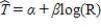 , where T is the tenacity and R is the amino acid ratio.
Perform the appropriate transformation of variable(s) and fit this logarithmic model to the data.
, where T is the tenacity and R is the amino acid ratio.
Perform the appropriate transformation of variable(s) and fit this logarithmic model to the data.
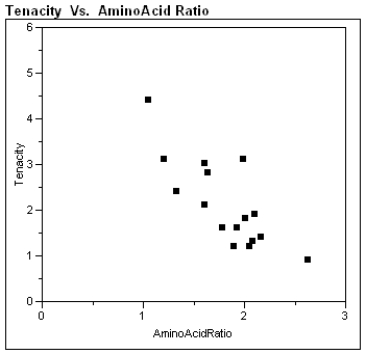 -Refer to Exhibit 4-2.
For an amino acid ratio of R = 1.5, what is the predicted tenacity?
-Refer to Exhibit 4-2.
For an amino acid ratio of R = 1.5, what is the predicted tenacity?
(Essay)
4.9/5 (32)
A transformation, or reexpression, of a variable is accomplished by substituting a function of the variable in place of the variable for further analysis.
(True/False)
4.8/5 (43)
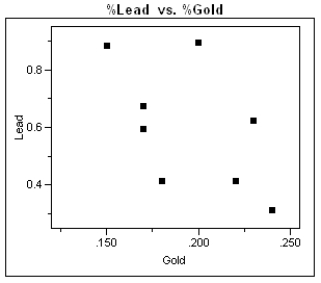
Exhibit 4-5
During the first 3 centuries AD, the Roman Empire produced coins in the Eastern provinces. Some historians argue that not all these coins were produced in local mints, and further that the mint of Rome struck some of them. Because the "style" of coins is difficult to analyze, the historians would like to use metallurgical analysis as one tool to identify the source mints of these coins. Investigators studied 11 coins known to have been produced by local mints in an attempt to identify a trace element profile for these coins, and have identified gold and lead as possible factors in identifying other coins as having been locally minted. The gold and lead content, measured as a % of weight of each coin, is given in the table, and a scatter plot of these data is presented below. 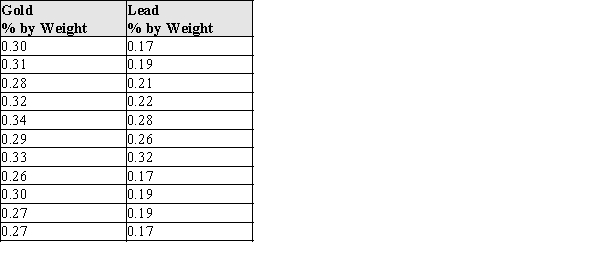
 -Refer to Exhibit 4-5.
a)What is the equation of the least squares best fit line?
b)Sketch the best fit line on the scatter plot.
c)What is the value of the correlation coefficient? Interpret this value.
d)What is the value of the coefficient of determination? Give an interpretation of this value.
-Refer to Exhibit 4-5.
a)What is the equation of the least squares best fit line?
b)Sketch the best fit line on the scatter plot.
c)What is the value of the correlation coefficient? Interpret this value.
d)What is the value of the coefficient of determination? Give an interpretation of this value.
(Essay)
4.8/5 (39)
Which of the following indicates the range of possible values for Pearson's correlation coefficient, r?
(Multiple Choice)
4.8/5 (40)
If  , the standard deviation of y is equal to the standard deviation of the residuals.
(True/False)
4.8/5 (38)
According to official data of "http://www.census.org/" population of Detroit, MI, is decreasing. Use the data from the table below for the population of Detroit to answer the following questions. 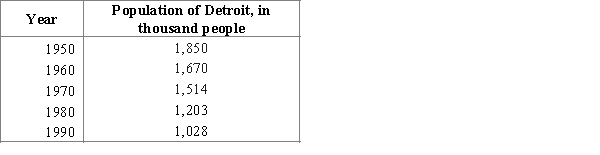 Find the predicted value for the population of Detroit in the year 2000 using the regression line. If the known population of Detroit in the year 2000 is about 951 thousand of people, what can you say about your predicted value? Why is it risky to use the least squares line to make the prediction for the next year?
(Multiple Choice)
4.8/5 (41)
The data below were gathered on a random sample of 5 basking sharks, swimming through the water and filter-feeding, i.e. passively letting the water bring food into their mouths. 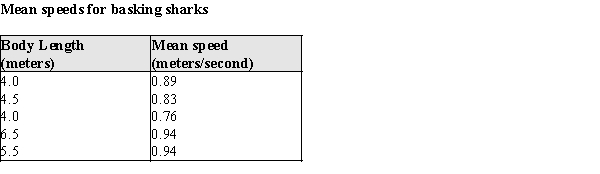
a)What is the value of the correlation coefficient for these data?
b)What is the equation of the least squares line describing the relationship between
x = body length and y = mean speed.
c)If these sharks are representative of the population of basking sharks, what would you predict is the mean speed for a filter-feeding basking shark that is 5.0 meters in length? Show any calculations below.
d)The largest basking shark in the sample is measured as 6.5 meters long. Theory predicts a maximum length of about 12.26 meters. Would it be reasonable to use the equation from part (b) above to predict the mean filter-feeding speed for a 12 meter long basking shark? Why or why not?
(Essay)
4.9/5 (38)
Data were collected on y = price of car (in dollars) and x = age of car (in years) for each car in a sample of 60 used Toyota Camrys. A scatterplot showed a negative linear relationship between x and y. The least squares regression line was fit and the  value was computed. If
  , which of the following is a correct statement?
(Multiple Choice)
4.9/5 (49)
Exhibit 4-4:
Biological theory suggests that the relationship between the weight of these animals and their wing length is exponential, i.e. W = α(10)βL, or W = α(e)βL where W is the wing weight and L is the wing length. 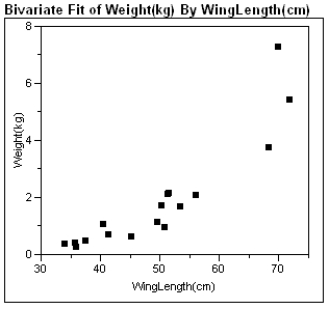 -Refer to Exhibit 4-4. What is the resulting best fit line using the transformed model?
(Essay)
4.7/5 (37)
The slopes of the least squares lines for predicting y from x, and the least squares line for predicting x from y, are equal.
(True/False)
4.8/5 (37)
When children and adolescents are discharged from the hospital the parents may still provide substantial care, such as the insertion of a feeding tube through the nose and down the esophagus into the stomach. It is difficult for parents to know how far to insert the tube, especially with rapidly growing infants. It may be possible for parents to measure their child's height and from that calculate the appropriate insertion length using a regression equation. At a major children's hospital, children and adolescents' heights and esophageal lengths were measured and a regression analysis performed. The data from this analysis is summarized below: 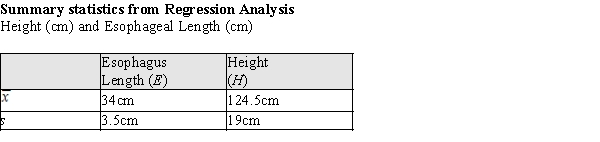 r = 0.995,
  = 11.476 + 0.181H
a)For a child with a height one standard deviation above the mean, what would be the predicted esophageal length?
b)What proportion of the variability in esophageal length is accounted for by the height of the children and adolescents?
c)From the information presented above, does it appear that the esophagus length can be accurately predicted from the height of young patients? Provide statistical evidence for your response.
= 11.476 + 0.181H
a)For a child with a height one standard deviation above the mean, what would be the predicted esophageal length?
b)What proportion of the variability in esophageal length is accounted for by the height of the children and adolescents?
c)From the information presented above, does it appear that the esophagus length can be accurately predicted from the height of young patients? Provide statistical evidence for your response.
(Essay)
4.8/5 (34)
Filters
- Essay(0)
- Multiple Choice(0)
- Short Answer(0)
- True False(0)
- Matching(0)