Exam 3: Numerical Methods for Describing Data Distributions
Exam 1: Collecting Data in Reasonable Ways56 Questions
Exam 2: Graphical Methods for Describing Data Distributions62 Questions
Exam 3: Numerical Methods for Describing Data Distributions37 Questions
Exam 4: Describing Bivariate Numerical Data70 Questions
Exam 5: Probability55 Questions
Exam 6: Random Variables and Probability Distributions72 Questions
Exam 7: An Overview of Statistical Inference - Learning From Data19 Questions
Exam 8: Sampling Variability and Sampling Distributions35 Questions
Exam 9: Estimating a Population Proportion36 Questions
Exam 10: Asking and Answering Questions About a Population Proportion31 Questions
Exam 11: Asking and Answering Questions About the Difference Between Two Proportions42 Questions
Exam 12: Asking and Answering Questions About a Population Mean51 Questions
Exam 13: Asking and Answering Questions About the Difference Between Two Means46 Questions
Exam 14: Learning From Categorical Data36 Questions
Exam 15: Understanding Relationships - Numerical Data Part 243 Questions
Exam 16: Asking and Answering Questions About More Than Two Means25 Questions
Select questions type
The accompanying data are consistent with summary statistics in a paper investigating the effect of the shape of drinking glasses. The data are the actual amount (in ml) poured into a tall, slender glass by individuals asked to pour 1.5 ounces (44.3 ml) into the glass. Compute the values of the mean and standard deviation. 
(Multiple Choice)
4.9/5  (35)
(35)
The mean number of text messages sent per month by customers of a cell phone service provider is 1,850, and the standard deviation is 800. Find the z-score associated with 3,000 messages sent.
(Multiple Choice)
4.8/5 (28)
A common topic of study among biologists who study social insects is colony integration, i.e. the ways members of a society interact with and influence each other. Previous research suggests that the queen of a wasp nest seems to encourage worker activity. That research is anecdotal, and quantitative information is lacking. The following data were gathered from wasp nests in California and Iowa. The nests were studied very early in their development, so each wasp could be individually identified using standard marking procedures, and their activity levels monitored reliably.
The table below contains the proportions of time spent on the nest for 12 randomly selected colonies in Iowa. (The colony numbers are for identification in the table only.) There is only one queen per nest, so the proportion is for her only. The workers proportion is the average proportion for all the worker bees in the nest. 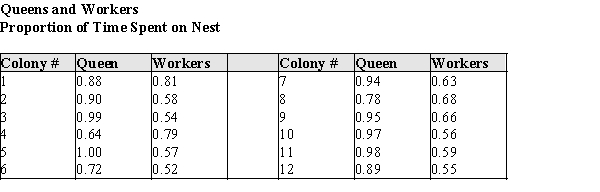
(a)Construct a comparative (back to back) stem & leaf plot of the proportions of time spent on the nest by Queens, and by Workers for these colonies.
(b)Using your plot in part (a), describe the differences and similarities in the distributions of the proportion of time spent on the nest by workers and queens.
(Essay)
4.8/5 (34)
Suppose that the distribution of weekly water usage for single-family homes in a particular city is mound shaped and approximately symmetric. The mean is 1,300 gallons, and the standard deviation is 200 gallons.
What is the approximate value of the 98th percentile?
(Multiple Choice)
4.9/5 (27)
Data on tipping percent for 20 restaurant tables are: 
Compute the value of the median for the above data set.
Compute the value of the median for the above data set.
(Multiple Choice)
4.9/5 (36)
To compare the average weekly earnings of full-time wages of male and female workers, twenty men and twenty women were selected. The following table contains average weekly wages of each person in the current month. 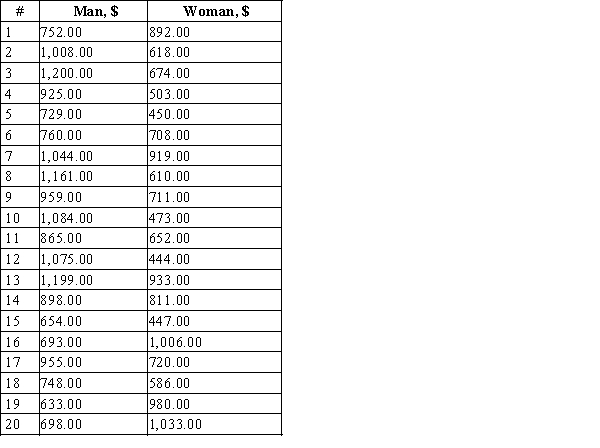 Use boxplot to make comparisons between weekly salary for man and woman.
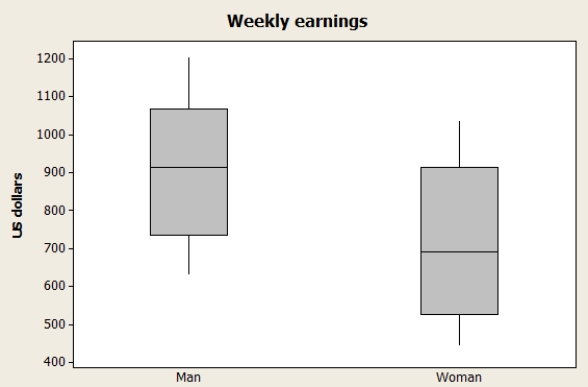
(Multiple Choice)
4.9/5 (39)
For any given data set, the median must be greater than or equal to the lower quartile, and less than or equal to the upper quartile.
(True/False)
4.9/5 (34)
The questions below refer to decisions made by statisticians and referred to in the text. Answer each of the following questions in a few sentences:
(a)Why was rather than
  chosen to be used in building the formula for the variance?
(b)Why is s more commonly used than s2 as a more useful measure of variability?
(c)Why was
chosen to be used in building the formula for the variance?
(b)Why is s more commonly used than s2 as a more useful measure of variability?
(c)Why was  chosen over
  when using s2 to estimate σ2?
(d)What factor should be considered when choosing between the median or mean as a description of the "center" of a data set?
when using s2 to estimate σ2?
(d)What factor should be considered when choosing between the median or mean as a description of the "center" of a data set?
(Essay)
4.8/5 (36)
The Territory of Iowa was initially surveyed in the 1830's. The surveyors were very careful to note the trees and vegetation; it was believed at that time that the richness of the soil could be measured by the density of trees encountered. The sample of hickory tree diameters from the original survey of what is now Linn County, Iowa, is presented in the stem and leaf plot below. The display uses five lines for each stem. Thus, "1t|" is the stem for diameters of 12 and 13, "1f|" for 14 and 15, "1s|" for 16 and 17, and so on. (The "t" then stands for leaves that are twos and threes, the "f" for leaves of fours and fives, etc.)The mean diameter of hickory trees in this sample is 11.849 inches, and the standard deviation is 3.995 inches. 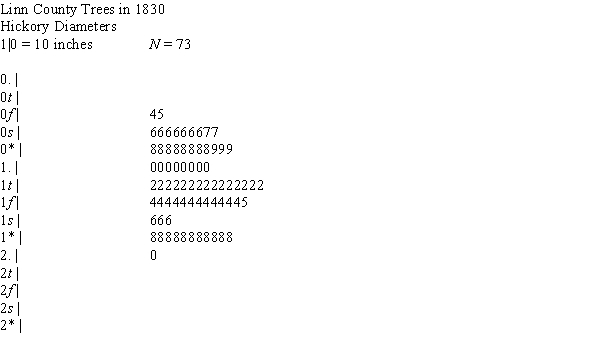
(a)What is the approximate diameter of a hickory tree at the 20th percentile in this distribution?
(b)The Empirical Rule would suggest that 68% of hickory tree diameters are between what two values?
(a)What is the approximate diameter of a hickory tree at the 20th percentile in this distribution?
(b)The Empirical Rule would suggest that 68% of hickory tree diameters are between what two values?
(Essay)
4.9/5 (34)
The % by weight of the element Lead was calculated for the coins minted in Rome. Some of the summary statistics are given in the table below. 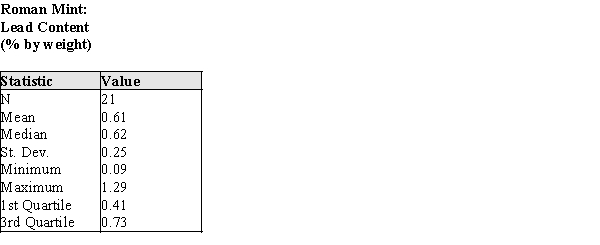
(a)Describe a procedure that uses these some or all of these summary statistics to determine whether outliers are present in the data.
(b)Using your procedure from part (a), determine if there are outliers in these data.
(a)Describe a procedure that uses these some or all of these summary statistics to determine whether outliers are present in the data.
(b)Using your procedure from part (a), determine if there are outliers in these data.
(Essay)
4.7/5 (39)
The dot plot below shows the annual salaries, in thousands of dollars, of a sample of non-management staff who work for a small banking company. 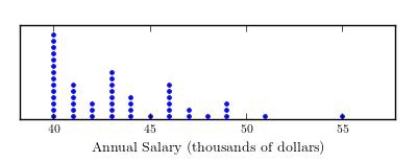 Which of the following statistics would be the most reasonable estimate of the typical annual salary?
(Multiple Choice)
4.9/5 (36)
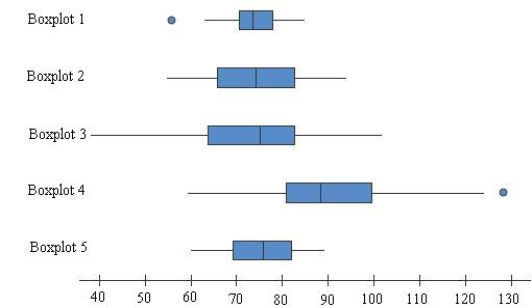
Which of the five boxplots shown in figure corresponds to a data set with the 5-number summary below?
Minimum: 60
Lower Quartile: 69
Median: 76
Upper Quartile: 82
Maximum: 89
(Multiple Choice)
4.9/5 (30)
Data on weekday exercise time (in minutes) for 20 males are shown below. Compute the interquartile range.
Male-Weekday 
(Multiple Choice)
4.8/5 (41)
The variance is the positive square root of the standard deviation.
(True/False)
4.8/5 (39)
The following nitrous oxide emissions (in thousands of tons) were recorded for the 48 states in the continental United States: 
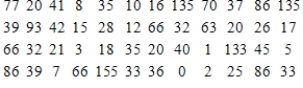
Use the above data to compute the values in the five-number summary.
Use the above data to compute the values in the five-number summary.
(Multiple Choice)
4.9/5 (36)
Filters
- Essay(0)
- Multiple Choice(0)
- Short Answer(0)
- True False(0)
- Matching(0)