Exam 12: Linear Regression and Correlation
Exam 1: What Is Statistics78 Questions
Exam 2: Describing Data: Frequency Distributions and Graphic Presentation101 Questions
Exam 3: Describing Data: Numerical Measures186 Questions
Exam 4: A Survey of Probability Concepts121 Questions
Exam 5: Discrete Probability Distributions111 Questions
Exam 6: The Normal Probability Distribution129 Questions
Exam 7: Sampling Methods and the Central Limit Theorem78 Questions
Exam 8: Estimation and Confidence Intervals128 Questions
Exam 9: One-Sample Tests of a Hypothesis223 Questions
Exam 10: Two-Sample Tests of Hypothesis87 Questions
Exam 11: Analysis of Variance80 Questions
Exam 12: Linear Regression and Correlation150 Questions
Exam 13: Multiple Regression and Correlation Analysis98 Questions
Exam 14: Chi-Square Applications for Nominal Data113 Questions
Exam 15: Index Numbers65 Questions
Exam 16: Time Series and Forecasting86 Questions
Exam 17: An Introduction to Decision Theory37 Questions
Select questions type
What happens to housing starts as interest rates fall?____________
(Short Answer)
4.9/5  (41)
(41)
Which value of r indicates a stronger correlation than 0.40?
(Multiple Choice)
4.8/5 (38)
i. The least squares technique minimizes the sum of the squares of the vertical distances between the actual Y values and the predicted values of Y.
ii. When a regression line has a zero slope, indicating a lack of a relationship, the line is vertical to the x-axis.
Iii) In regression analysis, the predicted value of Y' rarely agrees exactly with the actual Y value, i.e., we expect some prediction error.
(Multiple Choice)
4.9/5 (31)
The partial megastat output below is regression analysis of the relationship between annual payroll and number of wins in a season for 28 teams in professional sports. The purpose of the analysis is to predict the number of wins when given an annual payroll in $millions. Although technically not a sample, the baseball data below will be treated as a convenience sample of all major league professional sports. 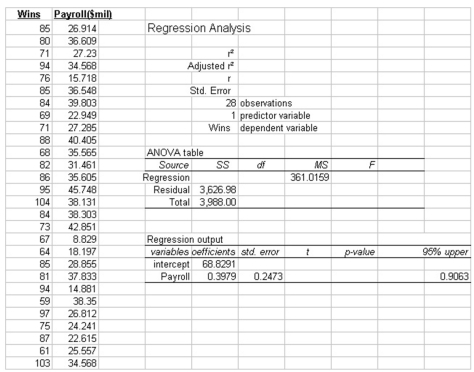 Refer to the printout above. How many degrees of freedom for Residual (Error)?
(Multiple Choice)
4.8/5 (40)
i. The basic question in testing the significance of rho is to see if there is zero correlation in the population from which the sample was selected.
Ii) A z test is used to test the significance of the coefficient of correlation.
Iii) Perfect correlation means that the scatter diagram will appear as a straight line
(Multiple Choice)
4.8/5 (40)
i. Trying to predict weekly sales with a standard error of estimate of $1,955, we would conclude that 68 percent of the predictions would not be off more than $1,955, 95 percent would not be off by more $3,910, and 99.7 percent would not be off by more than $5,865.
Ii) A confidence interval can be determined for the mean value of Y for a given value of X.
iii. Approximately 95% of the values lie within two standard errors of the regression line.
(Multiple Choice)
4.7/5 (33)
i. If the value of r is -0.96, what does this indicate about the dependent variable as the independent variable increases?
Ii) What is the value of the correlation coefficient if there is perfect correlation?
Iii) If the dependent variable is measured in dollars, in what units is the standard error of estimate measured?
(Multiple Choice)
4.9/5 (26)
A sales manager for an advertising agency believes there is a relationship between the number of contacts and the amount of the sales. To verify this believe, the following data was collected: 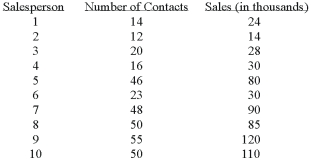
 What is the slope of the linear equation?
(Multiple Choice)
4.8/5 (25)
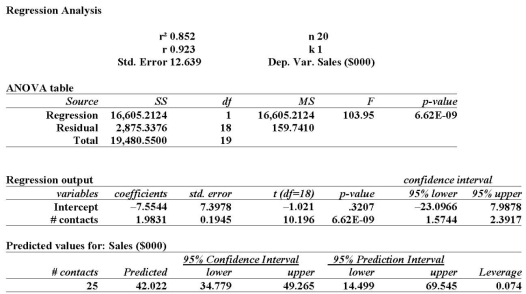
The partial megastat output below is regression analysis of the relationship between attendance and number of wins in a season for a sample of 11 teams in professional sports. The purpose of the analysis is to predict annual attendance (000) when given the number of wins. 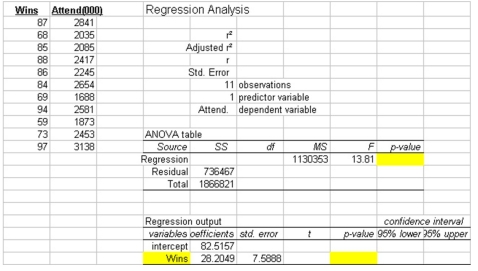 Refer to the printout above. The Sum of Squares Regression is:
(Multiple Choice)
4.8/5 (36)
What is the variable used to predict the value of another called?
(Multiple Choice)
4.8/5 (33)
A sales manager for an advertising agency believes there is a relationship between the number of contacts and the amount of the sales. To verify this believe, the following data was collected: 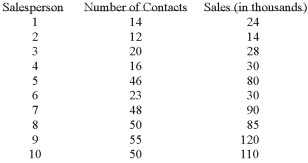
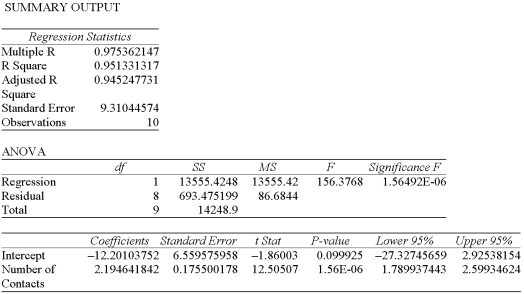 What is the value of the standard error of estimate?
(Multiple Choice)
4.8/5 (42)
i. If we are studying the relationship between high school performance and college performance, and want to predict college performance, high school performance is the independent variable.
ii. A financial advisor is interested in predicting bond yield based on bond term, i.e., one year, two years, etc. The dependent variable is bond yield.
Iii) The variable used to predict the value of another is called the independent variable.
(Multiple Choice)
4.9/5 (32)
A sales manager for an advertising agency believes there is a relationship between the number of contacts and the amount of the sales. To verify this belief, the following data was collected: 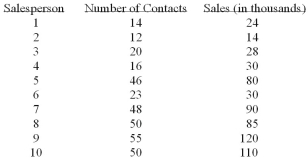
 The 95% confidence interval for 30 calls is
(Multiple Choice)
4.8/5 (33)
What is the range of values for the coefficient of determination?
(Multiple Choice)
4.9/5 (28)
Which of the following is true about the standard error of estimate?
(Multiple Choice)
4.8/5 (38)
Information was collected from employee records to determine whether there is an association between an employee's age and the number or workdays they miss. Partial excel results are
Summarized below from two different samples: 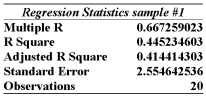
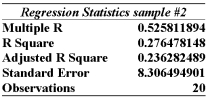 Given this information alone, would you decide to continue with the regression analysis for sample #1 or #2 or both?
(Multiple Choice)
4.9/5 (38)
For what interest rate will the maximum number of housing starts be achieved?____________
(Short Answer)
4.9/5 (38)
i. The technique used to measure the strength of the relationship between two sets of variables using the coefficient of correlation and the coefficient of determination is called regression analysis.
ii. In order to visualize the form of the regression equation, we can draw a scatter diagram.
Iii) The least squares technique minimizes the sum of the squares of the vertical distances between the actual Y values and the predicted values of Y.
(Multiple Choice)
4.8/5 (36)
i. The coefficient of determination is the proportion of the total variation in the dependent variable Y that is explained or accounted for by its relationship with the independent variable X.
Ii) The coefficient of determination is found by taking the square root of the coefficient of correlation.
iii. The standard error of estimate measures the accuracy of our prediction.
(Multiple Choice)
4.8/5 (37)
Filters
- Essay(0)
- Multiple Choice(0)
- Short Answer(0)
- True False(0)
- Matching(0)