Exam 12: Linear Regression and Correlation
Exam 1: What Is Statistics78 Questions
Exam 2: Describing Data: Frequency Distributions and Graphic Presentation101 Questions
Exam 3: Describing Data: Numerical Measures186 Questions
Exam 4: A Survey of Probability Concepts121 Questions
Exam 5: Discrete Probability Distributions111 Questions
Exam 6: The Normal Probability Distribution129 Questions
Exam 7: Sampling Methods and the Central Limit Theorem78 Questions
Exam 8: Estimation and Confidence Intervals128 Questions
Exam 9: One-Sample Tests of a Hypothesis223 Questions
Exam 10: Two-Sample Tests of Hypothesis87 Questions
Exam 11: Analysis of Variance80 Questions
Exam 12: Linear Regression and Correlation150 Questions
Exam 13: Multiple Regression and Correlation Analysis98 Questions
Exam 14: Chi-Square Applications for Nominal Data113 Questions
Exam 15: Index Numbers65 Questions
Exam 16: Time Series and Forecasting86 Questions
Exam 17: An Introduction to Decision Theory37 Questions
Select questions type
If the correlation between two variables is close to one, the association is
(Multiple Choice)
4.8/5  (40)
(40)
i. A t test is used to test the significance of the coefficient of correlation.
ii. When testing the strength of the relationship between two variables, the alternate hypothesis is: H0: ? 0.
Iii) Suppose a sample of 15 homes recently sold in your area is obtained. The correlation between the area of the home, in square feet, and the selling price is 0.40. We want to test the hypothesis that the correlation in the population is zero versus the alternate that it is greater than zero. You determine that the rejection region should fall in the lower tail if this is a one-tailed test and we use a 0.01 significance level.
(Multiple Choice)
4.7/5 (37)
If all the plots on a scatter diagram lie on a straight line, what is the standard error of estimate?
(Multiple Choice)
4.8/5 (39)
A sales manager for an advertising agency believes there is a relationship between the number of contacts and the amount of the sales. To verify this believe, the following data was collected: 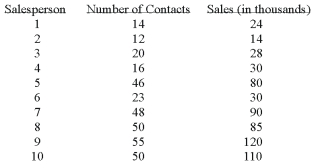
 What is the dependent variable?
(Multiple Choice)
4.8/5 (32)
We have collected price per share and dividend information from a sample of 30 companies. Using the Megastat printout, determine the regression equation that predicts the dividend from the stock's selling price. 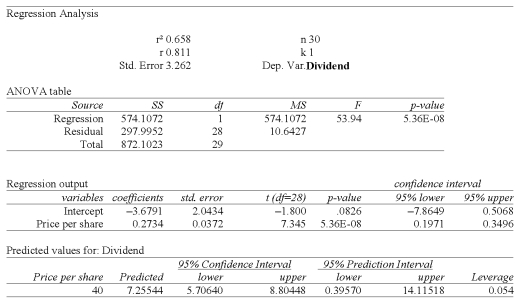
(Multiple Choice)
4.8/5 (25)
Use the scatter diagrams to verify which statements are correct:
Chart A 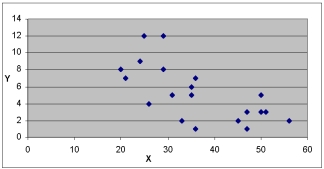 Chart B
 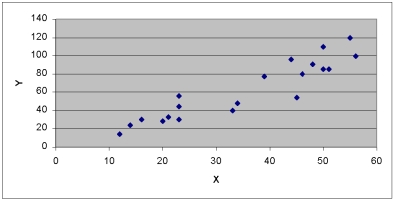 Chart C
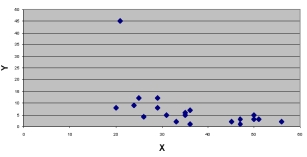
(Multiple Choice)
4.9/5 (34)
Given the following five points: (-2,0), (-1,0), (0,1), (1,1), and (2,3). What is the slope of the line?
(Multiple Choice)
4.8/5 (25)
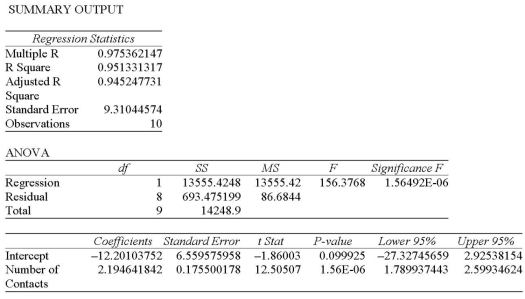
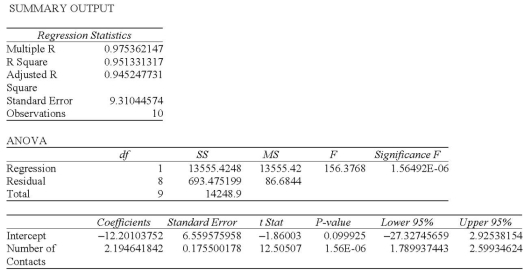
Data is collected from 20 sales people in order to verify that the more contacts made with potential clients, the greater the sales volume. The Excel printout is shown below. 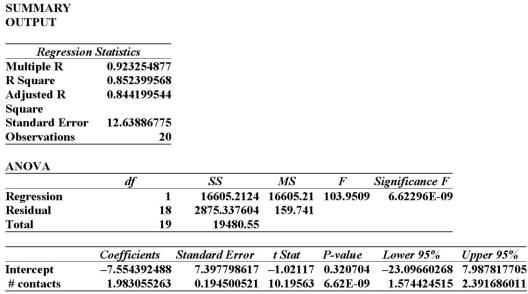 The slope in this instance indicates:
(Multiple Choice)
4.8/5 (32)
A sales manager for an advertising agency believes there is a relationship between the number of contacts and the amount of the sales. To verify this belief, the following data was collected: 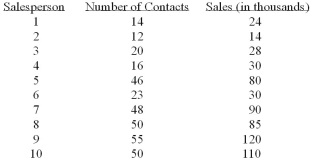 .
.  The calculated F value is
(Multiple Choice)
4.9/5 (40)
The difference between formulas for constructing a confidence interval and a prediction interval is
(Multiple Choice)
4.9/5 (39)
The correlation between two variables is -0.63 for a sample of 20 observations. What is the computed value of the test statistic?
(Multiple Choice)
4.8/5 (29)
i. In order to visualize the form of the regression equation, we can draw a scatter diagram.
ii. When a regression line has a zero slope, indicating a lack of a relationship, the line is vertical to the x-axis.
Iii) In regression analysis, the predicted value of Y' rarely agrees exactly with the actual Y value, i.e., we expect some prediction error.
(Multiple Choice)
4.8/5 (33)
Suppose the least squares regression equation is Y' = 1202 + 1,133X. When X = 3, what does Y' equal?
(Multiple Choice)
4.7/5 (40)
Information was collected from employee records to determine whether there is an association between an employee's age and the number or workdays they miss. Excel results are summarized
Below: 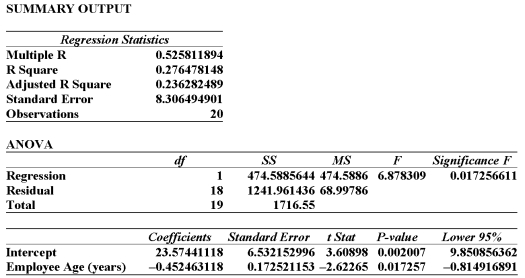 From this printout you determine:
(Multiple Choice)
4.9/5 (24)
Which value of r indicates a stronger correlation than 0.55?
(Multiple Choice)
4.9/5 (24)
The correlation between two variables is -0.63 for a sample of 20 observations. Which of the following is a correct conclusion based on the data given? Use the .05 significance level.
(Multiple Choice)
4.8/5 (38)
The partial megastat output below is regression analysis of the relationship between annual payroll and number of wins in a season for 28 teams in professional sports. The purpose of the analysis
Is to predict the number of wins when given an annual payroll in $millions. Although technically not a sample, the baseball data below will be treated as a convenience sample of all major league professional sports. 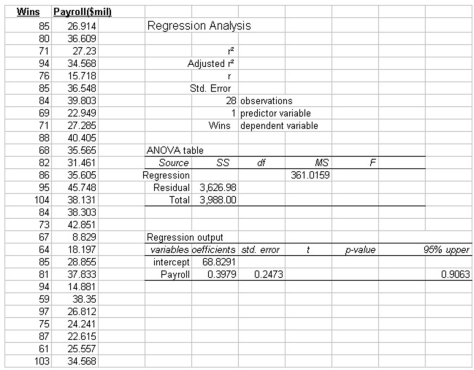 Refer to the printout above. The critical value of t, for testing the slope of the regression line is:
(Multiple Choice)
4.9/5 (44)
A sales manager for an advertising agency believes there is a relationship between the number of contacts and the amount of the sales. To verify this belief, the following data was collected: 
 The SS total is:
(Multiple Choice)
4.9/5 (34)
Information was collected from employee records to determine whether there is an association between an employee's age and the number or workdays they miss. Partial excel results are summarized below: 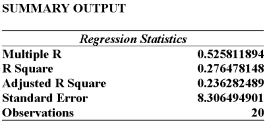 Given this information alone, would you decide to continue with the regression analysis?
(Multiple Choice)
4.8/5 (35)
Filters
- Essay(0)
- Multiple Choice(0)
- Short Answer(0)
- True False(0)
- Matching(0)