Exam 12: Linear Regression and Correlation
Exam 1: What Is Statistics78 Questions
Exam 2: Describing Data: Frequency Distributions and Graphic Presentation101 Questions
Exam 3: Describing Data: Numerical Measures186 Questions
Exam 4: A Survey of Probability Concepts121 Questions
Exam 5: Discrete Probability Distributions111 Questions
Exam 6: The Normal Probability Distribution129 Questions
Exam 7: Sampling Methods and the Central Limit Theorem78 Questions
Exam 8: Estimation and Confidence Intervals128 Questions
Exam 9: One-Sample Tests of a Hypothesis223 Questions
Exam 10: Two-Sample Tests of Hypothesis87 Questions
Exam 11: Analysis of Variance80 Questions
Exam 12: Linear Regression and Correlation150 Questions
Exam 13: Multiple Regression and Correlation Analysis98 Questions
Exam 14: Chi-Square Applications for Nominal Data113 Questions
Exam 15: Index Numbers65 Questions
Exam 16: Time Series and Forecasting86 Questions
Exam 17: An Introduction to Decision Theory37 Questions
Select questions type
The partial megastat output below is regression analysis of the relationship between annual payroll and number of wins in a season for 28 teams in professional sports. The purpose of the analysis
Is to predict the number of wins when given an annual payroll in $millions. Although technically not a sample, the baseball data below will be treated as a convenience sample of all major league professional sports.  Refer to the printout above. The critical value of F, at the 5%level of significance, to be used in the global test of the model is: (Choose closest)
(Multiple Choice)
4.8/5  (35)
(35)
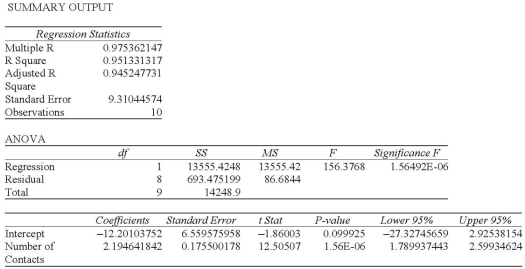
Data is collected from 20 sales people in order to verify that the more contacts made with potential clients, the greater the sales volume. The Excel printout is shown below. 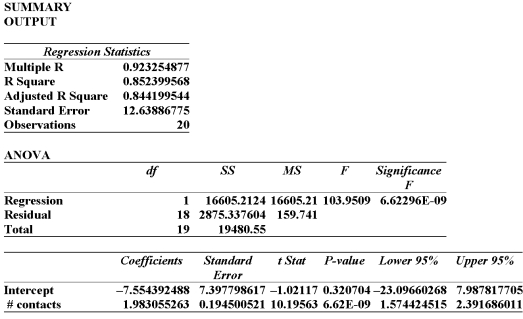 This model predicts that with 25 sales contacts, sales will be:
(Multiple Choice)
4.8/5 (30)
The partial megastat output below is regression analysis of the relationship between annual payroll and number of wins in a season for 28 teams in professional sports. The purpose of the analysis
Is to predict the number of wins when given an annual payroll in $millions. Although technically not a sample, the baseball data below will be treated as a convenience sample of all major league professional sports. 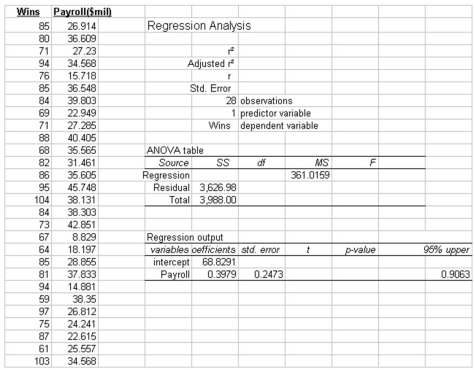 Refer to the printout above. The critical value of F, at the 5%level of significance, to be used in the global test of the model is: (Choose closest)
(Multiple Choice)
4.9/5 (31)
i. If the coefficient of correlation is 0.70, what is the coefficient of determination? ii. If the value of r is -0.88, what does this indicate about the dependent variable as the independent variable increases?
Iii) If the dependent variable is measured in hours, in what units is the standard error of estimate measured?
(Multiple Choice)
4.9/5 (33)
We have collected price per share and dividend information from a sample of 30 companies. 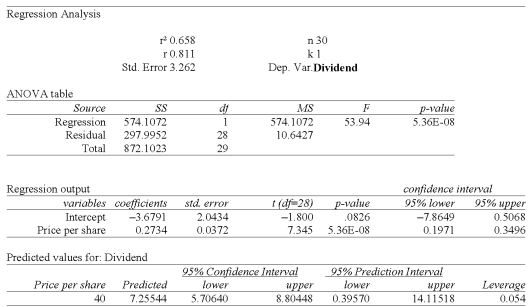 The y-intercept in this instance suggests:
(Multiple Choice)
4.8/5 (29)
i. In order to visualize the form of the regression equation, we can draw a scatter diagram.
ii. The least squares technique minimizes the sum of the squares of the vertical distances between the actual Y values and the predicted values of Y.
Iii) In regression analysis, the predicted value of Y' rarely agrees exactly with the actual Y value, i.e., we expect some prediction error.
(Multiple Choice)
4.8/5 (34)
Consider the following scatter plot and regression line. At x = 33, the residual (error term) is 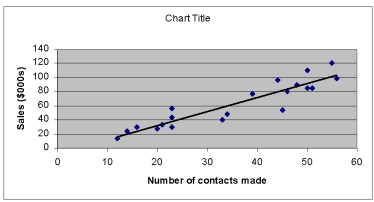
(Multiple Choice)
4.9/5 (43)
i. A scatter diagram is a chart that portrays the relationship between two variables.
ii. If a scatter diagram shows very little scatter about a straight line drawn through the plots, it indicates a rather weak relationship.
Iii) A scatter diagram may be put together using excel or megastat.
(Multiple Choice)
5.0/5 (30)
The partial megastat output below is regression analysis of the relationship between annual payroll and number of wins in a season for 28 teams in professional sports. The purpose of the analysis is to predict the number of wins when given an annual payroll in $millions. Although technically not a sample, the baseball data below will be treated as a convenience sample of all major league professional sports  Refer to the printout above. The regression equation is:
(Multiple Choice)
4.7/5 (39)
Information was collected from employee records to determine whether there is an association between an employee's age and the number or workdays they miss. Excel results are summarized below: 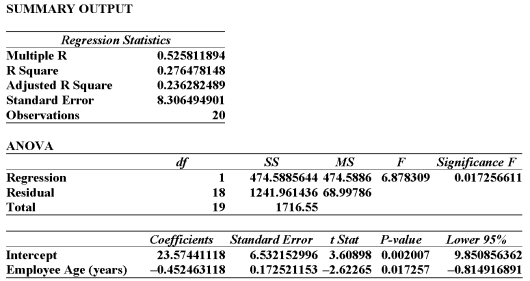 From this printout you determine:
(Multiple Choice)
4.9/5 (32)
What will be the number of housing starts if the interest rate is 8.25%?____________
(Short Answer)
4.9/5 (30)
Given the following five points: (-2,0), (-1,0), (0,1), (1,1), and (2,3). If the regression equation is Y' = 2 - 0.4X, what is the value of Y' when X = -3?
(Multiple Choice)
4.9/5 (34)
The partial megastat output below is regression analysis of the relationship between annual payroll and number of wins in a season for 28 teams in professional sports. The purpose of the analysis
Is to predict the number of wins when given an annual payroll in $millions. Although technically not a sample, the baseball data below will be treated as a convenience sample of all major league professional sports. 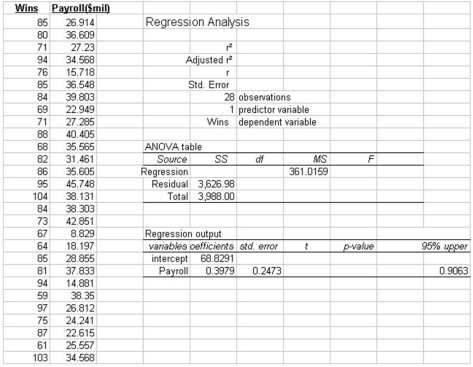 Refer to the printout above. Predict the annual attendance (000) for a team with 100 wins
(Multiple Choice)
4.8/5 (29)
i. The technique used to measure the strength of the relationship between two sets of variables using the coefficient of correlation and the coefficient of determination is called regression analysis.
ii. In order to visualize the form of the regression equation, we can draw a scatter diagram.
Iii) When a regression line has a zero slope, indicating a lack of a relationship, the line is horizontal to the x-axis.
(Multiple Choice)
4.9/5 (31)
A sales manager for an advertising agency believes there is a relationship between the number of contacts and the amount of the sales. To verify this believe, the following data was collected: 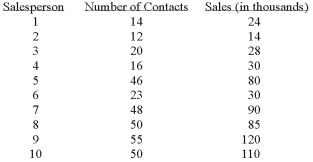
 What is the Y-intercept of the linear equation?
(Multiple Choice)
4.8/5 (32)
What will be the number of housing starts if the interest rate rose to 16%?____________
(Short Answer)
4.8/5 (28)
If r = 0.65, what does the coefficient of determination equal?
(Multiple Choice)
4.9/5 (35)
i. A coefficient of correlation r close to 0 (say, 0.08) shows that the relationship between two variables is quite weak.
Ii) A coefficient of correlation of -0.96 indicates a very weak negative correlation.
Iii) If the coefficient of correlation is 0.68, the coefficient of determination is 0.4624.
(Multiple Choice)
4.8/5 (42)
Filters
- Essay(0)
- Multiple Choice(0)
- Short Answer(0)
- True False(0)
- Matching(0)