Exam 12: Linear Regression and Correlation
Exam 1: What Is Statistics78 Questions
Exam 2: Describing Data: Frequency Distributions and Graphic Presentation101 Questions
Exam 3: Describing Data: Numerical Measures186 Questions
Exam 4: A Survey of Probability Concepts121 Questions
Exam 5: Discrete Probability Distributions111 Questions
Exam 6: The Normal Probability Distribution129 Questions
Exam 7: Sampling Methods and the Central Limit Theorem78 Questions
Exam 8: Estimation and Confidence Intervals128 Questions
Exam 9: One-Sample Tests of a Hypothesis223 Questions
Exam 10: Two-Sample Tests of Hypothesis87 Questions
Exam 11: Analysis of Variance80 Questions
Exam 12: Linear Regression and Correlation150 Questions
Exam 13: Multiple Regression and Correlation Analysis98 Questions
Exam 14: Chi-Square Applications for Nominal Data113 Questions
Exam 15: Index Numbers65 Questions
Exam 16: Time Series and Forecasting86 Questions
Exam 17: An Introduction to Decision Theory37 Questions
Select questions type
Given the following five points: (-2,0), (-1,0), (0,1), (1,1), and (2,3). What is the Y intercept?
(Multiple Choice)
4.9/5  (30)
(30)
A sales manager for an advertising agency believes there is a relationship between the number of contacts and the amount of the sales. To verify this believe, the following data was collected: 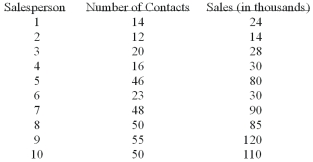
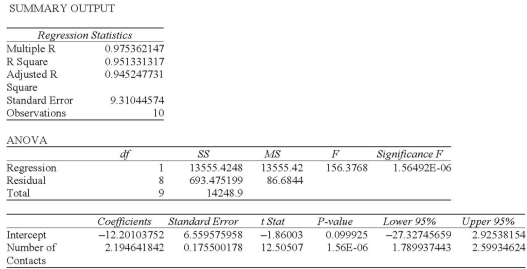 The 95% prediction interval for a particular person making 30 calls is:
(Multiple Choice)
4.9/5 (40)
When comparing the 95% confidence and prediction intervals for a given regression analysis,
(Multiple Choice)
4.8/5 (37)
We have collected price per share and dividend information from a sample of 30 companies. 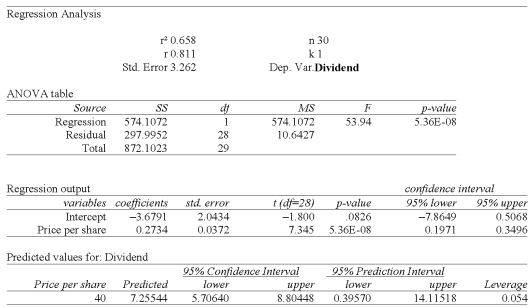 The slope in this instance indicates:
(Multiple Choice)
4.8/5 (36)
i. Perfect correlation means that the scatter diagram will appear as a straight line ii. If the coefficient of correlation is 0.80, the coefficient of determination is 0.64.
iii. The coefficient of determination can assume values between 0% and 100%
(Multiple Choice)
4.8/5 (25)
The partial megastat output below is regression analysis of the relationship between annual payroll and number of wins in a season for 28 teams in professional sports. The purpose of the analysis
Is to predict the number of wins when given an annual payroll in $millions. Although technically not a sample, the baseball data below will be treated as a convenience sample of all major league professional sports. 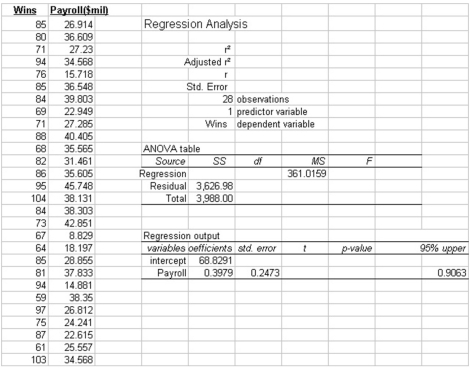 Refer to the printout above. How many independent variables?
(Multiple Choice)
4.7/5 (26)
i. Trying to predict weekly sales with a standard error of estimate of $1,955, we would conclude that 68 percent of the predictions would not be off more than $1,955, 95 percent would not be off by more
$3,910, and 99.7 percent would not be off by more than $5,865. T6
Ii) The smaller the sample, the smaller the possible error as measured by the standard error of estimate. F6
Iii) Approximately 95% of the values lie within two standard errors of the regression line.
(Multiple Choice)
5.0/5 (40)
A regression analysis yields the following information: Y' = 2.24 + 1.49 X S y x = 1.66; ∑x = 32; ∑x2 = 134; n = 10
Compute the 95% confidence interval when X = 4.
(Multiple Choice)
4.7/5 (29)
i. If there is absolutely no relationship between two variables, what will Pearson's r equal? ii. If the value of r is -0.96, what does this indicate about the dependent variable as the independent variable increases?
Iii) What is the value of the correlation coefficient if there is perfect correlation?
(Multiple Choice)
4.8/5 (32)
Information was collected from employee records to determine whether there is an association between an employee's age and the number or workdays they miss. Excel results are summarized below: 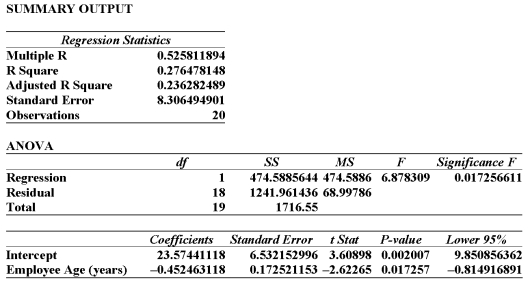 From this printout you determine:
(Multiple Choice)
4.8/5 (33)
i. A coefficient of correlation r close to 0 (say, 0.08) shows that the relationship between two variables is quite weak.
Ii) A coefficient of correlation of -0.96 indicates a very weak negative correlation.
iii. The coefficient of determination can only be positive.
(Multiple Choice)
4.9/5 (27)
Given the scatter diagram below, that shows the number of workdays absent per year based on the age of the employees, which of the following statements are true? 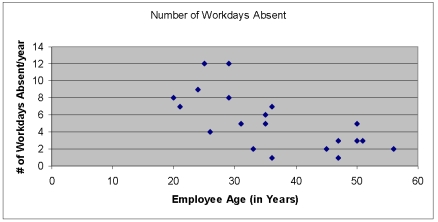
(Multiple Choice)
4.9/5 (34)
Using a 95% significance level, what is the critical value for the F-statistic? 
(Multiple Choice)
4.8/5 (33)
i. The strength of the correlation between two variables depends on the sign of the coefficient of correlation.
Ii) A coefficient of correlation r close to 0 (say, 0.08) shows that the relationship between two variables is quite weak.
Iii) The coefficient of determination is found by taking the square root of the coefficient of correlation.
(Multiple Choice)
4.9/5 (37)
Filters
- Essay(0)
- Multiple Choice(0)
- Short Answer(0)
- True False(0)
- Matching(0)