Exam 12: Linear Regression and Correlation
Exam 1: What Is Statistics78 Questions
Exam 2: Describing Data: Frequency Distributions and Graphic Presentation101 Questions
Exam 3: Describing Data: Numerical Measures186 Questions
Exam 4: A Survey of Probability Concepts121 Questions
Exam 5: Discrete Probability Distributions111 Questions
Exam 6: The Normal Probability Distribution129 Questions
Exam 7: Sampling Methods and the Central Limit Theorem78 Questions
Exam 8: Estimation and Confidence Intervals128 Questions
Exam 9: One-Sample Tests of a Hypothesis223 Questions
Exam 10: Two-Sample Tests of Hypothesis87 Questions
Exam 11: Analysis of Variance80 Questions
Exam 12: Linear Regression and Correlation150 Questions
Exam 13: Multiple Regression and Correlation Analysis98 Questions
Exam 14: Chi-Square Applications for Nominal Data113 Questions
Exam 15: Index Numbers65 Questions
Exam 16: Time Series and Forecasting86 Questions
Exam 17: An Introduction to Decision Theory37 Questions
Select questions type
i. The purpose of correlation analysis is to find how strong the relationship is between two variables.
ii. A coefficient of correlation of -0.96 indicates a very weak negative correlation.
iii. The standard error of estimate measures the accuracy of our prediction.
(Multiple Choice)
4.8/5  (29)
(29)
i. In order to visualize the form of the regression equation, we can draw a scatter diagram.
ii. In regression analysis, the predicted value of Y' rarely agrees exactly with the actual Y value, i.e., we expect some prediction error.
Iii) The technique used to measure the strength of the relationship between two sets of variables using the coefficient of correlation and the coefficient of determination is called regression analysis.
(Multiple Choice)
4.8/5 (34)
Which of the following is NOT a difference between a confidence interval and a prediction interval?
(Multiple Choice)
4.8/5 (26)
Information was collected from employee records to determine whether there is an association between an employee's age and the number or workdays they miss. Excel results are summarized below: 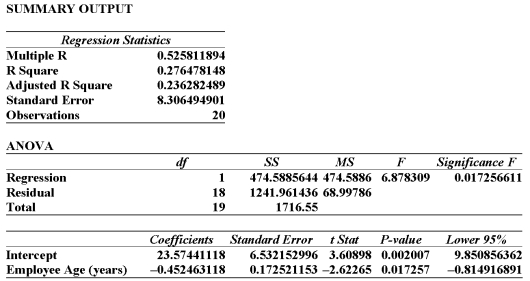 From this printout you determine:
(Multiple Choice)
4.9/5 (30)
If the decision in the hypothesis test of the population correlation coefficient is to reject the null hypothesis, what can we conclude about the correlation in the population?
(Multiple Choice)
4.9/5 (26)
What is the range of values for a coefficient of correlation?
(Multiple Choice)
4.7/5 (32)
i. Correlation analysis is a group of statistical techniques used to measure the strength of the relationship (correlation) between two variables.
Ii) A correlation coefficient of -1 or +1 indicates perfect correlation.
Iii) The strength of the correlation between two variables depends on the sign of the coefficient of correlation.
(Multiple Choice)
4.9/5 (32)
i. The technique used to measure the strength of the relationship between two sets of variables using the coefficient of correlation and the coefficient of determination is called regression analysis.
ii. In order to visualize the form of the regression equation, we can draw a scatter diagram.
Iii) A line found using the least squares principle is the best-fitting line because the sum of the squares of the vertical deviations between the actual and estimated values is minimized.
(Multiple Choice)
4.9/5 (41)
What is the chart called when the paired data (the dependent and independent variables) are plotted?
(Multiple Choice)
4.8/5 (37)
i. Trying to predict weekly sales with a standard error of estimate of $1,955, we would conclude that 68 percent of the predictions would not be off more than $1,955, 95 percent would not be off by more $3,910, and 99.7 percent would not be off by more than $5,865.
Ii) Approximately 68% of the values lie within one standard error of the regression line
Iii) For a set of observations, there is no difference in the width of a confidence interval and the width of a predictor interval.
(Multiple Choice)
4.7/5 (29)
The partial megastat output below is regression analysis of the relationship between annual payroll and number of wins in a season for 28 teams in professional sports. The purpose of the analysis
Is to predict the number of wins when given an annual payroll in $millions. Although technically not a sample, the baseball data below will be treated as a convenience sample of all major league professional sports. 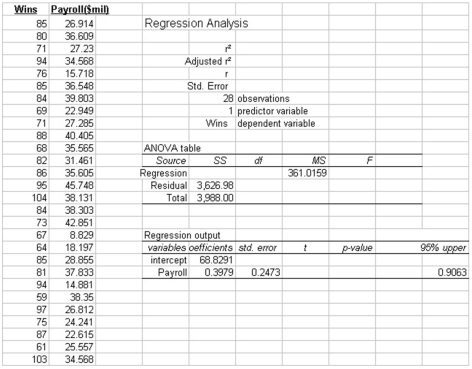 Refer to the printout above. How many independent variables?
(Multiple Choice)
4.8/5 (33)
i. The coefficient of correlation is a measure of the strength of relationship between two variables.
ii. The coefficient of determination can only be positive.
Iii) The standard error of estimate measures the accuracy of our prediction.
(Multiple Choice)
4.8/5 (37)
The partial megastat output below is regression analysis of the relationship between annual payroll and number of wins in a season for 28 teams in professional sports. The purpose of the analysis is to predict the number of wins when given an annual payroll in $millions. Although technically not a sample, the baseball data below will be treated as a convenience sample of all major league professional sports.  Refer to the printout above. Predict the number of wins for a team with PAYROLL = 25(million) (nearest whole number)
(Multiple Choice)
4.8/5 (39)
i. The technique used to measure the strength of the relationship between two sets of variables using the coefficient of correlation and the coefficient of determination is called regression analysis.
ii. In order to visualize the form of the regression equation, we can draw a scatter diagram.
Iii) When a regression line has a zero slope, indicating a lack of a relationship, the line is horizontal to the x-axis.
(Multiple Choice)
4.8/5 (34)
The partial megastat output below is regression analysis of the relationship between annual payroll and number of wins in a season for 28 teams in professional sports. The purpose of the analysis
Is to predict the number of wins when given an annual payroll in $millions. Although technically not a sample, the baseball data below will be treated as a convenience sample of all major league professional sports. 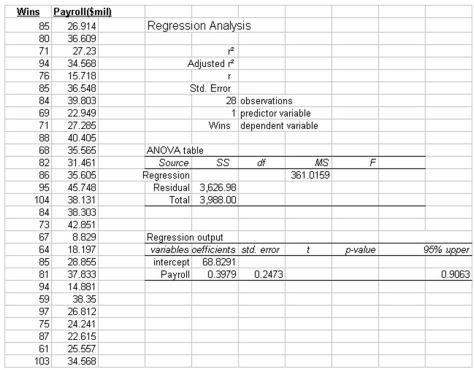 Refer to the printout above. The critical value of t, at the 5% level of significance, for testing the coefficient of correlation is:
(Multiple Choice)
4.7/5 (41)
Given the scatter diagram below, that shows the number of workdays absent per year based on the age of the employees, which of the following statements are true? 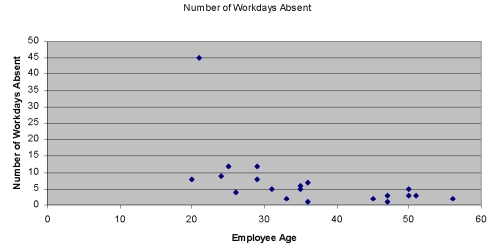
(Multiple Choice)
4.8/5 (40)
A regression analysis yields the following information: Y' = 2.24 + 1.49 X S y x = 1.66; ∑x = 32; ∑x2 = 134; n = 10
Estimate the value of Y' when X = 4.
(Multiple Choice)
4.8/5 (32)
i. If the coefficient of correlation is 0.80, what is the coefficient of determination? ii. What is a measure of the scatter of observed values around the regression line called?
Iii) If the correlation between sales and advertising is +0.6, what percent of the variation in sales can be attributed to advertising?
(Multiple Choice)
4.9/5 (36)
Filters
- Essay(0)
- Multiple Choice(0)
- Short Answer(0)
- True False(0)
- Matching(0)