Exam 12: Linear Regression and Correlation
Exam 1: What Is Statistics78 Questions
Exam 2: Describing Data: Frequency Distributions and Graphic Presentation101 Questions
Exam 3: Describing Data: Numerical Measures186 Questions
Exam 4: A Survey of Probability Concepts121 Questions
Exam 5: Discrete Probability Distributions111 Questions
Exam 6: The Normal Probability Distribution129 Questions
Exam 7: Sampling Methods and the Central Limit Theorem78 Questions
Exam 8: Estimation and Confidence Intervals128 Questions
Exam 9: One-Sample Tests of a Hypothesis223 Questions
Exam 10: Two-Sample Tests of Hypothesis87 Questions
Exam 11: Analysis of Variance80 Questions
Exam 12: Linear Regression and Correlation150 Questions
Exam 13: Multiple Regression and Correlation Analysis98 Questions
Exam 14: Chi-Square Applications for Nominal Data113 Questions
Exam 15: Index Numbers65 Questions
Exam 16: Time Series and Forecasting86 Questions
Exam 17: An Introduction to Decision Theory37 Questions
Select questions type
i. If we are studying the relationship between high school performance and college performance, and want to predict college performance, high school performance is the dependent variable.
Ii) A financial advisor is interested in predicting bond yield based on bond term, i.e., one year, two years, etc. The dependent variable is bond term.
Iii) The variable used to predict the value of another is called the dependent variable.
(Multiple Choice)
4.8/5  (37)
(37)
i. The coefficient of determination can only be positive.
ii. If the coefficient of correlation is 0.68, the coefficient of determination is 0.4624.
iii. The standard error of estimate measures the accuracy of our prediction.
(Multiple Choice)
4.9/5 (35)
i. The smaller the sample, the smaller the possible error as measured by the standard error of estimate. F6
Ii) Approximately 68% of the values lie within two standard errors of the regression line.
Iii) For a set of observations, there is no difference in the width of a confidence interval and the width of a predictor interval.F6
(Multiple Choice)
4.8/5 (40)
i. Trying to predict weekly sales with a standard error of estimate of $1,955, we would conclude that 68 percent of the predictions would not be off more than $1,955, 95 percent would not be off by more $3,910, and 99.7 percent would not be off by more than $5,865.
Ii) Approximately 95% of the values lie within two standard errors of the regression line
Iii) The smaller the sample, the smaller the possible error as measured by the standard error of estimate.
(Multiple Choice)
4.9/5 (28)
If the correlation coefficient between two variables equals zero, what can be said of the variables X and Y?
(Multiple Choice)
4.8/5 (35)
In the least squares equation, Y' = 10 + 20X the value of 20 indicates
(Multiple Choice)
4.9/5 (39)
In the regression equation, Y' = a + bX, what does the letter "b" represent?
(Multiple Choice)
4.9/5 (35)
Assume the least squares equation is Y' = 10 + 20X. What does the value of 10 in the equation indicate?
(Multiple Choice)
4.8/5 (39)
We have collected price per share and dividend information from a sample of 30 companies. 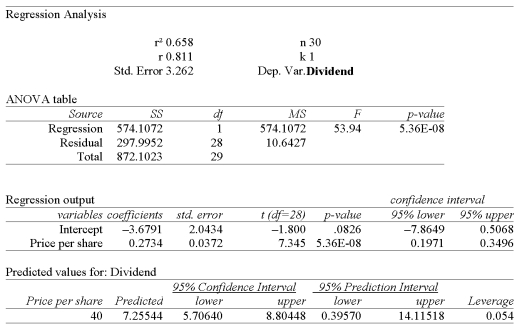 Determine the 95% confidence interval for Dividends when the stock price is $40 per share:
(Multiple Choice)
4.8/5 (33)
Filters
- Essay(0)
- Multiple Choice(0)
- Short Answer(0)
- True False(0)
- Matching(0)