Exam 2: Describing Data: Frequency Distributions and Graphic Presentation
Exam 1: What Is Statistics78 Questions
Exam 2: Describing Data: Frequency Distributions and Graphic Presentation101 Questions
Exam 3: Describing Data: Numerical Measures186 Questions
Exam 4: A Survey of Probability Concepts121 Questions
Exam 5: Discrete Probability Distributions111 Questions
Exam 6: The Normal Probability Distribution129 Questions
Exam 7: Sampling Methods and the Central Limit Theorem78 Questions
Exam 8: Estimation and Confidence Intervals128 Questions
Exam 9: One-Sample Tests of a Hypothesis223 Questions
Exam 10: Two-Sample Tests of Hypothesis87 Questions
Exam 11: Analysis of Variance80 Questions
Exam 12: Linear Regression and Correlation150 Questions
Exam 13: Multiple Regression and Correlation Analysis98 Questions
Exam 14: Chi-Square Applications for Nominal Data113 Questions
Exam 15: Index Numbers65 Questions
Exam 16: Time Series and Forecasting86 Questions
Exam 17: An Introduction to Decision Theory37 Questions
Select questions type
Refer to the following ages (rounded to the nearest whole year) of employees at a large company that were grouped into a distribution with class limits:
20 up to 30
30 up to 40
40 up to 50
50 up to 60
60 up to 70.
-The class interval is ___________.
(Short Answer)
4.8/5  (27)
(27)
Refer to the following ages (rounded to the nearest whole year) of employees at a large company that were grouped into a distribution with class limits:
20 up to 30
30 up to 40
40 up to 50
50 up to 60
60 up to 70
What is the class interval and the midpoint of the first class?
(Multiple Choice)
4.9/5 (36)
Refer to the following chart showing a distribution of exporting firms: 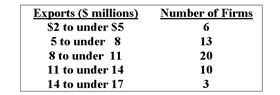 -What percentage of the firms export less than $14 million in product?
(Multiple Choice)
4.8/5 (36)
(i) A frequency distribution is grouping of data into classes showing the number of observations in each class.
(ii) In constructing a frequency distribution, you should try to have open-ended classes such as "Under
$100" and "$1,000 and over".
(iii) A cumulative frequency distribution is used when we want to determine how many observations lie above or below certain values.
(Multiple Choice)
4.7/5 (35)
A row of a stem-and-leaf chart appears as follows: 3 | 0 1 3 5 7 9. Assume that the data is rounded to the nearest unit.
(Multiple Choice)
4.7/5 (28)
A useful chart or graph to use for illustrating relative frequencies is the_____ ?
(Short Answer)
4.9/5 (38)
The monthly incomes of a small sample of computer operators are $1,950, $1,775, $2,060, $1,840, $1,795, $1,890, $1,925 and $1,810. What are these ungrouped numbers called?
(Multiple Choice)
4.8/5 (36)
In a frequency distribution, what is the number of observations in a class called?
(Multiple Choice)
5.0/5 (31)
Refer to the following price of jeans are recorded to the nearest dollar: The first two class midpoints are $62.50 and $65.50. What are the class limits for the third class?
(Multiple Choice)
4.8/5 (29)
Refer to the following distribution of commissions: 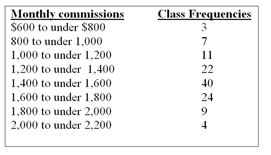 -The first plot for a cumulative greater than frequency distribution should be:
(Multiple Choice)
4.8/5 (29)
Quinn's Café serves ice cream. She asks 100 of her regular customers to take a taste test and pick the flavour they like the best. The results are shown in the following table. 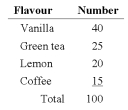 Is the data quantitative or qualitative? What is the name of the table shown?
(Multiple Choice)
4.8/5 (33)
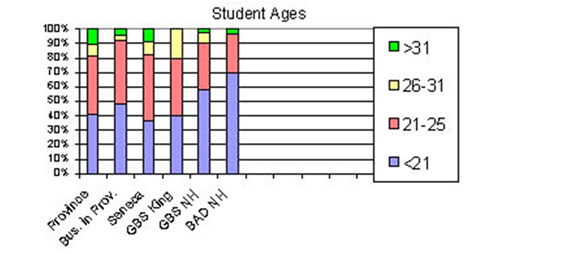 -Comparing the values province wide, business students across the province and across Seneca College, which of these three groups has the larger proportion of students under 21?
(Multiple Choice)
4.9/5 (44)
Refer to the following distribution of ages: 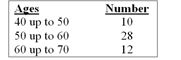 -For the distribution of ages above, what is the relative class frequency for the lowest class?
(Multiple Choice)
4.9/5 (29)
Refer to the following ages (rounded to the nearest whole year) of employees at a large company that were grouped into a distribution with class limits:
20 up to 30
30 up to 40
40 up to 50
50 up to 60
60 up to 70.
-IQs were tested for a number of students. The first three IQs are 105, 115, and 125.
The upper limit for the third class ___________s .
(Short Answer)
4.9/5 (43)
Given the following stem and leaf plot, determine the smallest value in the data set. 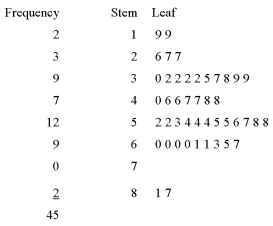
(Multiple Choice)
4.8/5 (34)
Refer to the following cumulative frequency distribution on days absent during a calendar year by employees of a manufacturing company: 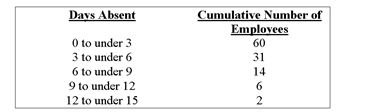 -How many employees were absent fewer than six days?
(Multiple Choice)
4.8/5 (37)
The monthly salaries of a sample of 100 employees were rounded to the nearest ten dollars. They ranged from a low of $1,040 to a high of $1,720. If we want to condense the data into seven classes, what is the most convenient class interval?
(Multiple Choice)
4.9/5 (35)
(i) In constructing a frequency distribution, you should try to have open-ended classes such as "Under $100" and "$1,000 and over".
(ii) To convert a frequency distribution to a relative frequency distribution, divide each class frequency by the sum of the class frequencies.
(iii) When constructing a frequency distribution, try to include overlapping stated class limits, such as
100 up to 201, 200 up to 301, and 300 up to 401.
(Multiple Choice)
4.9/5 (26)
Filters
- Essay(0)
- Multiple Choice(0)
- Short Answer(0)
- True False(0)
- Matching(0)