Exam 2: Describing Data: Frequency Distributions and Graphic Presentation
Exam 1: What Is Statistics78 Questions
Exam 2: Describing Data: Frequency Distributions and Graphic Presentation101 Questions
Exam 3: Describing Data: Numerical Measures186 Questions
Exam 4: A Survey of Probability Concepts121 Questions
Exam 5: Discrete Probability Distributions111 Questions
Exam 6: The Normal Probability Distribution129 Questions
Exam 7: Sampling Methods and the Central Limit Theorem78 Questions
Exam 8: Estimation and Confidence Intervals128 Questions
Exam 9: One-Sample Tests of a Hypothesis223 Questions
Exam 10: Two-Sample Tests of Hypothesis87 Questions
Exam 11: Analysis of Variance80 Questions
Exam 12: Linear Regression and Correlation150 Questions
Exam 13: Multiple Regression and Correlation Analysis98 Questions
Exam 14: Chi-Square Applications for Nominal Data113 Questions
Exam 15: Index Numbers65 Questions
Exam 16: Time Series and Forecasting86 Questions
Exam 17: An Introduction to Decision Theory37 Questions
Select questions type
Refer to the following cumulative frequency distribution on days absent during a calendar year by employees of a manufacturing company: 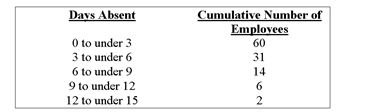 -How many employees were absent six or more days?
(Multiple Choice)
4.8/5  (26)
(26)
Refer to the following price of jeans are recorded to the nearest dollar: The first two class midpoints are $62.50 and $65.50. What is the class interval?
(Multiple Choice)
5.0/5 (38)
A group of 100 students were surveyed about their interest in a new International Studies program. The survey asked students about their interest in the program in terms of high, medium, or low. 30 students responded high interest; 50 students responded medium interest; 40 students responded low interest. What is the relative frequency of students with high interest?
(Multiple Choice)
4.8/5 (34)
The chart below shows the Gross Domestic Product for 7 nations. Which of the following statements can be determined from this chart? 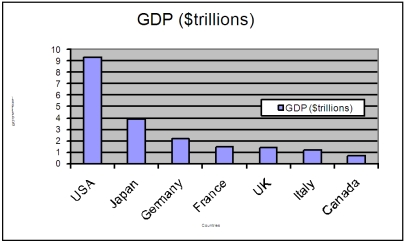
(Multiple Choice)
4.9/5 (34)
Which of the following would be most helpful if you wished to construct a pie chart?
(Multiple Choice)
4.9/5 (29)
The Lake Ontario Credit Union selected a sample of 40 student chequing accounts. Below is a chart of their end-of-the-month balances. The bank considers any student with an ending balance of $400 or more a "preferred customer". Estimate the number of preferred customers in this sample. 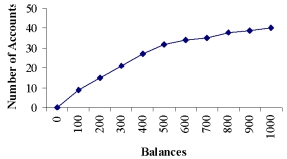
(Multiple Choice)
4.7/5 (42)
For a stem-and-leaf display, the stem for the value 67 is_____ .
(Short Answer)
4.8/5 (38)
Statistics Canada report 2010 results in the following chart. 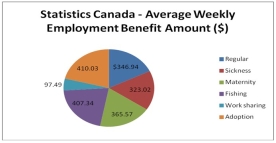 Is the data quantitative or qualitative? What is the name of the table shown?
(Multiple Choice)
4.8/5 (36)
The suggested class interval based on number of observations given the data ranges from 100 to 200
with 50 observations is_____ .
(Short Answer)
4.8/5 (43)
For the following distribution of heights, what are the limits for the class with the greatest frequency? 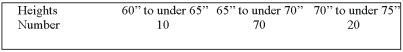
(Multiple Choice)
5.0/5 (38)
Refer to the following cumulative frequency distribution on days absent during a calendar year by employees of a manufacturing company:
-What is the class midpoint of the highest class?
(Multiple Choice)
4.8/5 (39)
The best means to display data that is based on a trend over a period of time is the__________ .
(Short Answer)
4.8/5 (30)
A sample distribution of hourly earnings in Paul's Cookie Factory is: 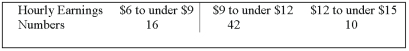 The limits of the class with the smallest frequency are:
(Multiple Choice)
4.7/5 (31)
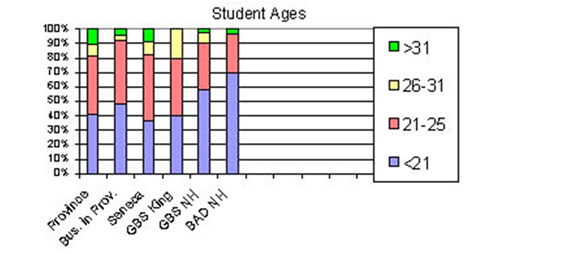 -Students under the age of 26 account for approximately what proportion of Business students across the province?
(Multiple Choice)
4.8/5 (38)
Consider the following stem and leaf plot:  Suppose that you decided to develop a frequency distribution from this plot. What would be the lower limit of the first class?
(Multiple Choice)
4.8/5 (45)
Refer to the following chart showing a distribution of exporting firms: 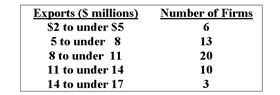 -For the distribution above, what is the midpoint of the class with the greatest frequency?
(Multiple Choice)
4.9/5 (36)
The age distribution of a sample of the part-time employees at Lloyd's Fast Food Emporium is: 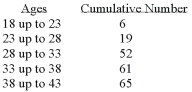 What type of chart has the data been organized to draw?
(Multiple Choice)
4.9/5 (35)
(i) A frequency distribution is grouping of data into classes showing the number of observations in each class.
(ii) The midpoint of a class, which is also called a class mark, is halfway between the lower and upper limits.
(iii) A class interval, which is the width of a class, can be determined by subtracting the lower limit of a class from the lower limit of the next higher class.
(Multiple Choice)
4.9/5 (41)
Filters
- Essay(0)
- Multiple Choice(0)
- Short Answer(0)
- True False(0)
- Matching(0)