Exam 2: Describing Data: Frequency Distributions and Graphic Presentation
Exam 1: What Is Statistics78 Questions
Exam 2: Describing Data: Frequency Distributions and Graphic Presentation101 Questions
Exam 3: Describing Data: Numerical Measures186 Questions
Exam 4: A Survey of Probability Concepts121 Questions
Exam 5: Discrete Probability Distributions111 Questions
Exam 6: The Normal Probability Distribution129 Questions
Exam 7: Sampling Methods and the Central Limit Theorem78 Questions
Exam 8: Estimation and Confidence Intervals128 Questions
Exam 9: One-Sample Tests of a Hypothesis223 Questions
Exam 10: Two-Sample Tests of Hypothesis87 Questions
Exam 11: Analysis of Variance80 Questions
Exam 12: Linear Regression and Correlation150 Questions
Exam 13: Multiple Regression and Correlation Analysis98 Questions
Exam 14: Chi-Square Applications for Nominal Data113 Questions
Exam 15: Index Numbers65 Questions
Exam 16: Time Series and Forecasting86 Questions
Exam 17: An Introduction to Decision Theory37 Questions
Select questions type
Refer to the following chart showing a distribution of exporting firms: 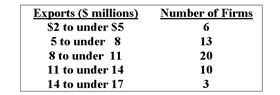 -What is the class interval?
(Multiple Choice)
4.9/5  (32)
(32)
Refer to the following distribution of commissions: 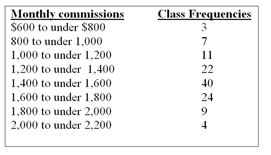 -What is the relative frequency for those salespersons that earn between $1,600 and $1,799?
(Multiple Choice)
4.8/5 (32)
Refer to the following ages (rounded to the nearest whole year) of employees at a large company that were grouped into a distribution with class limits:
20 up to 30
30 up to 40
40 up to 50
50 up to 60
60 up to 70.
-The class limits for the class 50 up to 60 class are _________and_______ .
(Short Answer)
4.9/5 (30)
In a cumulative frequency distribution,_______ percent of the total frequencies would fall below the upper limit of the highest class.
(Short Answer)
4.9/5 (37)
The following class intervals for a frequency distribution were developed to provide information regarding the starting salaries for students graduating from a particular school: 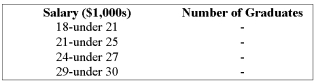 Before data was collected, someone questioned the validity of this arrangement. Which of the following represents a problem with this set of intervals?
(Multiple Choice)
4.8/5 (40)
(i) Bar charts are useful for showing the percent that various components compose of the total. (ii) Simple bar charts may be constructed either horizontally or vertically. (iii) A line chart is ideal for showing the trend or sales of income over time.
(Multiple Choice)
4.9/5 (26)
The grades on a statistics exam for a sample of students are as follows: 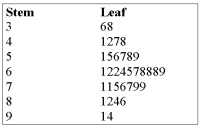 If A + = 90%-100% A = 80%-89% B+ = 75%-79% B = 70%-74% C+ = 65%-69% C = 60%-64%
D = 55%-59%
F = 0%-54
What is the most common letter grade earned?
If A + = 90%-100% A = 80%-89% B+ = 75%-79% B = 70%-74% C+ = 65%-69% C = 60%-64%
D = 55%-59%
F = 0%-54
What is the most common letter grade earned?
(Multiple Choice)
4.8/5 (32)
Refer to the following distribution of ages: 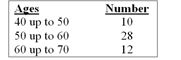 -What is the class interval?
(Multiple Choice)
4.9/5 (40)
In constructing a frequency polygon, the class frequencies are scaled on the______axis.
(Short Answer)
4.9/5 (30)
Refer to the following ages (rounded to the nearest whole year) of employees at a large company that were grouped into a distribution with class limits:
20 up to 30
30 up to 40
40 up to 50
50 up to 60
60 up to 70.
-IQs were tested for a number of students. The first three IQs are 105, 115, and 125.
The class interval is_____ .
(Short Answer)
4.8/5 (37)
The Lake Ontario Credit Union selected a sample of 40 student chequing accounts. Below is a chart of their end-of-the-month balances. The bank considers any student with an ending balance of $400 or more a "preferred customer". Estimate the percentage of preferred customers. 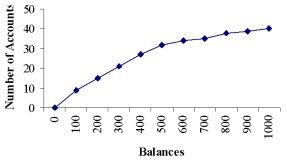
(Multiple Choice)
4.8/5 (29)
Refer to the following distribution of commissions:
-What is the relative frequency for those salespersons that earn between $1,500 and $1,800?
(Multiple Choice)
4.8/5 (28)
What are the true class limits for the $55 up to $65 class? 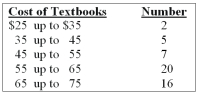
(Multiple Choice)
4.8/5 (33)
Given the following stem and leaf plot, determine the largest value in the data set. 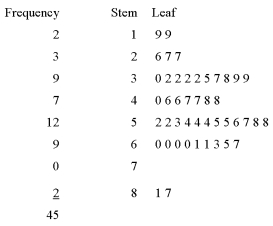
(Multiple Choice)
4.9/5 (32)
Why are unequal class intervals sometimes used in a frequency distribution?
(Multiple Choice)
4.8/5 (36)
Refer to the following distribution of commissions:
-One rule that must always be followed in constructing frequency distributions is that .
(Multiple Choice)
4.8/5 (28)
Filters
- Essay(0)
- Multiple Choice(0)
- Short Answer(0)
- True False(0)
- Matching(0)