Exam 2: Describing Data: Frequency Distributions and Graphic Presentation
Exam 1: What Is Statistics78 Questions
Exam 2: Describing Data: Frequency Distributions and Graphic Presentation101 Questions
Exam 3: Describing Data: Numerical Measures186 Questions
Exam 4: A Survey of Probability Concepts121 Questions
Exam 5: Discrete Probability Distributions111 Questions
Exam 6: The Normal Probability Distribution129 Questions
Exam 7: Sampling Methods and the Central Limit Theorem78 Questions
Exam 8: Estimation and Confidence Intervals128 Questions
Exam 9: One-Sample Tests of a Hypothesis223 Questions
Exam 10: Two-Sample Tests of Hypothesis87 Questions
Exam 11: Analysis of Variance80 Questions
Exam 12: Linear Regression and Correlation150 Questions
Exam 13: Multiple Regression and Correlation Analysis98 Questions
Exam 14: Chi-Square Applications for Nominal Data113 Questions
Exam 15: Index Numbers65 Questions
Exam 16: Time Series and Forecasting86 Questions
Exam 17: An Introduction to Decision Theory37 Questions
Select questions type
Refer to the following distribution of commissions: 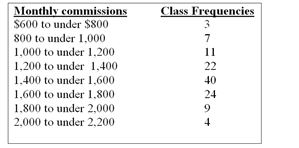 -What is the class interval for the table of wages above?
(Multiple Choice)
4.8/5  (29)
(29)
The following represent the ages of students in a class:
19, 23, 21, 19, 19, 20, 22, 31, 21, 20
If a stem and leaf plot were to be developed from this, how many leaves would there be off the second stem?
(Multiple Choice)
4.7/5 (35)
Consider the following relative frequency distribution: 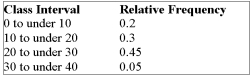 If there are 2,000 numbers in the data set, how many of the values are less than 30?
(Multiple Choice)
4.8/5 (31)
Refer to the following ages (rounded to the nearest whole year) of employees at a large company that were grouped into a distribution with class limits:
20 up to 30
30 up to 40
40 up to 50
50 up to 60
60 up to 70.
-The midpoint for the class 40 up to 50 is _______.
(Short Answer)
4.8/5 (28)
Refer to the following distribution of commissions:
-What is the class midpoint for the class with the greatest frequency?
(Multiple Choice)
4.8/5 (30)
If the enrolment for this Faculty of Business remained constant at 625 between 2000 and 2001, determine the change in the enrolment in the School of Accounting during this time. 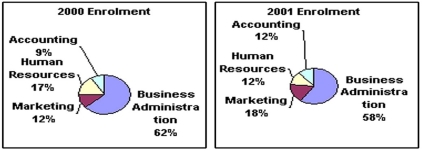
(Multiple Choice)
4.9/5 (33)
(i) A frequency table is a grouping of qualitative data into mutually exclusive classes showing the number of observations in each class. (ii) Simple bar charts may be constructed either horizontally or vertically.
(iii) A relative frequency table shows the fraction or percent of the number of observations in each class.
(Multiple Choice)
4.9/5 (32)
(i) Pie charts are useful for showing the percent that various components compose of the total. (ii) Simple bar charts may be constructed either horizontally or vertically. (iii) A line chart is ideal for showing the trend or sales of income over time.
(Multiple Choice)
4.9/5 (32)
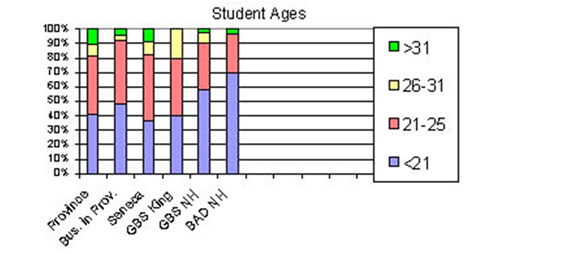 -Province wide, approximately what proportion of students is over the age of 31?
(Multiple Choice)
4.9/5 (35)
Refer to the following distribution of commissions: 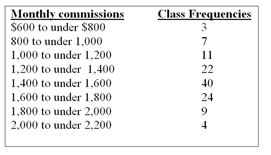 -What is the relative frequency of those salespersons that earn more than $1,599?
(Multiple Choice)
4.7/5 (36)
Analyze the graph below. Do you find any inconsistencies or errors? 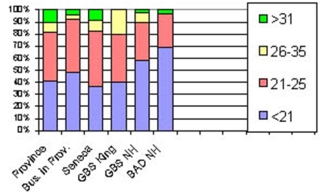
(Multiple Choice)
4.9/5 (43)
If you are constructing a stem-and-leaf display, the "20" in 20.5 would be the ______.
(Short Answer)
4.7/5 (28)
Refer to the following cumulative frequency distribution on days absent during a calendar year by employees of a manufacturing company: 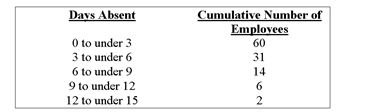 -How many employees were absent from 6 to under 12 days?
(Multiple Choice)
5.0/5 (33)
(i). The stem in a stem-and-leaf display is the leading digit
(ii) There is no loss of information when raw data is tallied into a stem-and-leaf display.
(iii). For a stem-and-leaf display, the leaf for the value 98 is 9
(Multiple Choice)
4.9/5 (28)
Refer to the following price of jeans are recorded to the nearest dollar: The first two class midpoints are $62.50 and $65.50. What are the class limits for the lowest class?
(Multiple Choice)
4.7/5 (40)
The chart below shows the Gross Domestic Product for 7 nations. Which of the following statements can be determined from this chart? 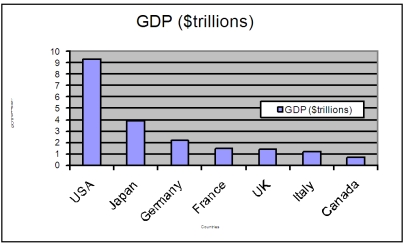
(Multiple Choice)
4.8/5 (38)
Filters
- Essay(0)
- Multiple Choice(0)
- Short Answer(0)
- True False(0)
- Matching(0)