Exam 10: Data Analysisstatistics: an Introduction
Exam 1: An Introduction to Problem Solving85 Questions
Exam 2: Introduction to Logic and Sets153 Questions
Exam 3: Numeration Systems and Whole Number Operations194 Questions
Exam 4: Number Theory116 Questions
Exam 5: Integers122 Questions
Exam 6: Rational Numbers and Proportional Reasoning85 Questions
Exam 7: Rational Numbers As Decimals and Percents102 Questions
Exam 8: Real Numbers and Algebraic Thinking151 Questions
Exam 9: Probability129 Questions
Exam 10: Data Analysisstatistics: an Introduction57 Questions
Exam 11: Introductory Geometry115 Questions
Exam 12: Congruence and Similarity With Constructions121 Questions
Exam 13: Congruence and Similarity With Transformations56 Questions
Exam 14: Area, Pythagorean Theorem, and Volume124 Questions
Select questions type
Use the statistical display to answer the question.
-The midterm test scores for the seventh-period typing class are shown below on a dot plot. 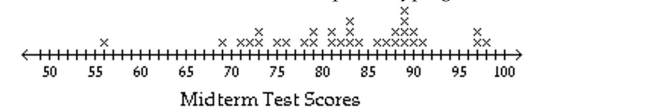 What cluster has the highest scores?
Free
(Multiple Choice)
4.8/5  (32)
(32)
Correct Answer: Verified
C
Use the figure to answer the question.
-The following scatterplot shows the heights (in inches)of a group of children and their ages. 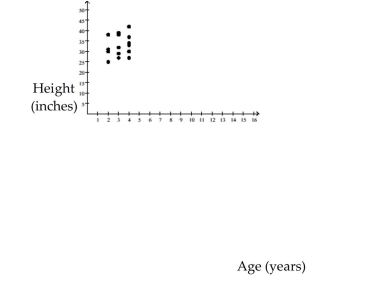 What can be the expected height range for a 2-year-old child?
Free
(Multiple Choice)
4.9/5 (39)
Correct Answer:Verified
A
Use the figure to answer the question.
-The following scatterplot shows the heights (in inches)of a group of children and their ages. 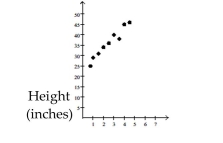 Age (years) From this data, conjecture how old you think a child is who is about 39 inches tall?
Free
(Multiple Choice)
4.9/5 (35)
Correct Answer:Verified
C
Use the figure to answer the question.
-The heights (in inches)of a group of high school students are listed below in a back-to-back stem-and-leaf plot. Male Stem Female 889 5 578 13466789 6 012223455689 0012223 7 002 Which gender has the tallest student?
(Multiple Choice)
4.9/5 (38)
Use the statistical display to answer the question.
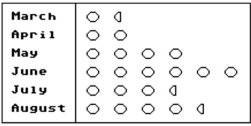
-Marriage Licenses Issued
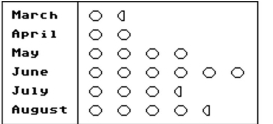 (Each Orepresents 20,000 licenses)
How many more licenses are issued in June than in July?
(Each Orepresents 20,000 licenses)
How many more licenses are issued in June than in July?
(Multiple Choice)
4.8/5 (38)
Use the statistical display to answer the question.
-Marriage Licenses Issued
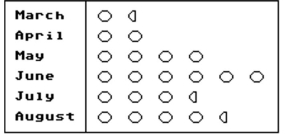 (Each Orepresents 20,000 licenses)
Which months differ the most in the number of licenses issued and by how much?
(Each Orepresents 20,000 licenses)
Which months differ the most in the number of licenses issued and by how much?
(Multiple Choice)
4.7/5 (34)
Use the figure to answer the question.
-The weights (in pounds)of a group of high school students are listed below in a stem-and-leaf plot.
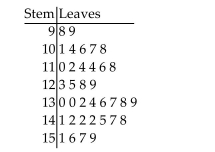 Which interval has the most students in it?
(Multiple Choice)
4.8/5 (37)
Use the circle graph to solve the problem.
-The circle graph shows the percent of the total population of 93,700 of Springfield living in the given types of housing. 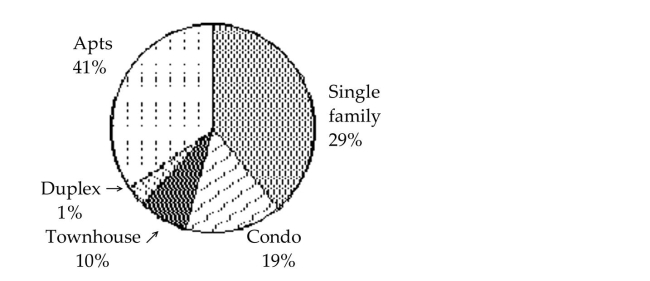 Find the number of people who live in single family houses. Round your result to the nearest whole Number.
(Multiple Choice)
4.8/5 (38)
Identify whether the given scatterplot shows a positive association, negative association, or no association.
-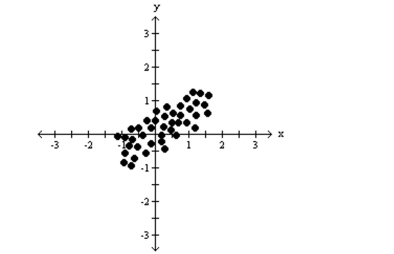
(Multiple Choice)
4.8/5 (31)
Use the circle graph to solve the problem.
-In a school survey, students showed these preferences for instructional materials. 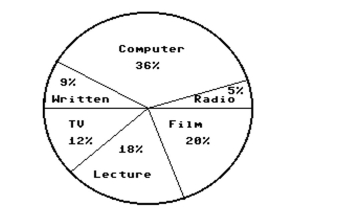 About how many students would you expect to prefer TV in a school of 500 students?
(Multiple Choice)
4.8/5 (39)
Use the figure to answer the question.
-The sales figures for the Big "D" Company are shown below in a line graph. 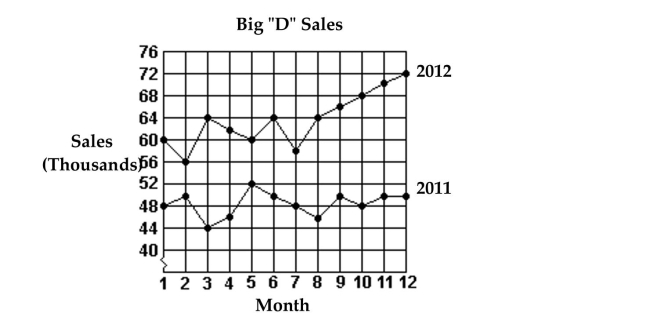 What were the total sales for the first 6 months of 2012?
(Multiple Choice)
4.9/5 (42)
Use the statistical display to answer the question.
-Marriage Licenses Issued
 (Each Orepresents 20,000 licenses)
In which month are the most licenses issued and how many are issued?
(Each Orepresents 20,000 licenses)
In which month are the most licenses issued and how many are issued?
(Multiple Choice)
4.9/5 (29)
Use the circle graph to solve the problem.
-A survey of the 9729 vehicles on the campus of State University yielded the following circle graph. 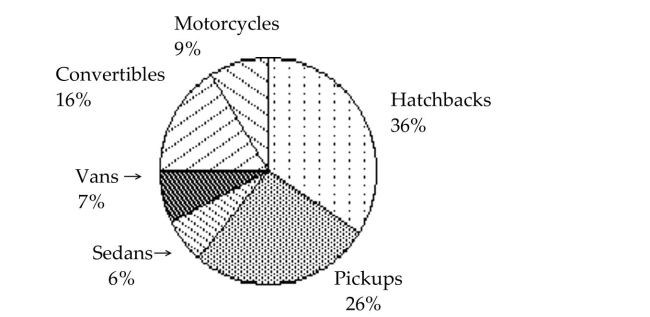 Find the number of hatchbacks. Round your result to the nearest whole number.
(Multiple Choice)
4.8/5 (33)
Use the figure to answer the question.
-The heights (in inches)of a group of high school students are listed below in a back-to-back stem-and-leaf plot. 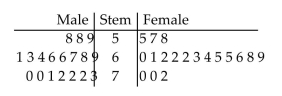 Which interval has the most students in it?
(Multiple Choice)
4.9/5 (36)
Use the figure to answer the question.
-This double-bar graph shows the number of male (M)and female (F)athletes at a university over a four-year period. 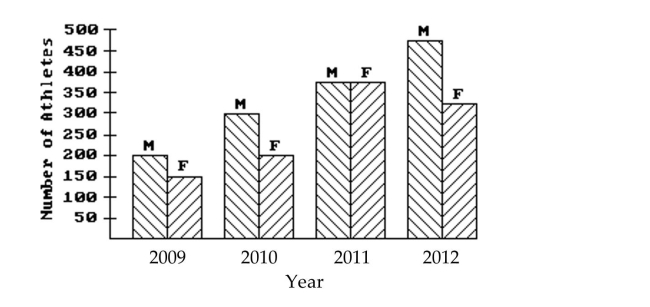 What is the only year in which the number of female athletes declined from its previous value?
(Multiple Choice)
4.9/5 (21)
Use the figure to answer the question.
-The weights (in pounds)of a group of high school students are listed below in a stem-and-leaf plot.
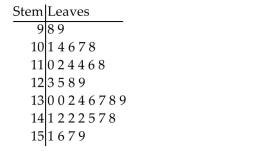 What is the most frequent weight?
(Multiple Choice)
4.8/5 (28)
Use the figure to answer the question.
-The bar graph below shows the number of students by major in the College of Arts and Sciences. 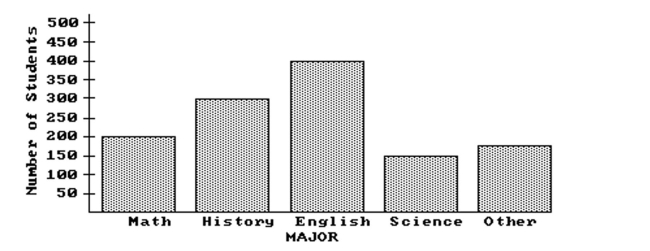 What is the ratio of history majors to the total number of students in the college?
(Multiple Choice)
4.8/5 (24)
Use the figure to answer the question.
-The average amount of weekend television viewing of high school students is shown below and used to create a frequency table. 3.5 6 8 7 9.5 4 6.5 10 4.5 7 8.5 3 8.5 6 7 5.5 7.5 3.5 Frequency Distribution Table Hours Tally Frequency 3-4.5 I I I I I 5 5-6.5 I I I I 4 7-8.5 I I I I I I 7 9-10 I I 2 Total =20 Which interval has the greatest amount of students?
(Multiple Choice)
4.8/5 (32)
Use the figure to answer the question.
-The weights (in pounds)of a group of high school students are listed below in a stem-and-leaf plot.
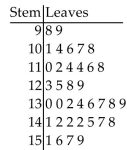 What does represent on the plot?
(Multiple Choice)
4.8/5 (25)
Use the figure to answer the question.
-The heights (in inches)of a group of high school students are listed below in a back-to-back stem-and-leaf plot. 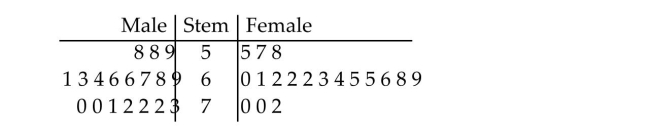 Which gender has the greatest average height?
(Multiple Choice)
4.9/5 (42)
Filters
- Essay(0)
- Multiple Choice(0)
- Short Answer(0)
- True False(0)
- Matching(0)