Exam 10: Data Analysisstatistics: an Introduction
Exam 1: An Introduction to Problem Solving85 Questions
Exam 2: Introduction to Logic and Sets153 Questions
Exam 3: Numeration Systems and Whole Number Operations194 Questions
Exam 4: Number Theory116 Questions
Exam 5: Integers122 Questions
Exam 6: Rational Numbers and Proportional Reasoning85 Questions
Exam 7: Rational Numbers As Decimals and Percents102 Questions
Exam 8: Real Numbers and Algebraic Thinking151 Questions
Exam 9: Probability129 Questions
Exam 10: Data Analysisstatistics: an Introduction57 Questions
Exam 11: Introductory Geometry115 Questions
Exam 12: Congruence and Similarity With Constructions121 Questions
Exam 13: Congruence and Similarity With Transformations56 Questions
Exam 14: Area, Pythagorean Theorem, and Volume124 Questions
Select questions type
Construct the requested statistical display.
-The attendance counts for this season's basketball games are listed below. Draw a stem-and-leaf plot for the data. 227 239 215 219 221 233 229 233 235 228 245 231
Attend ance Counts for This
Season's Basketball Games

(Multiple Choice)
4.8/5  (39)
(39)
Use the figure to answer the question.
-The bar graph below shows the number of students by major in the College of Arts and Sciences. 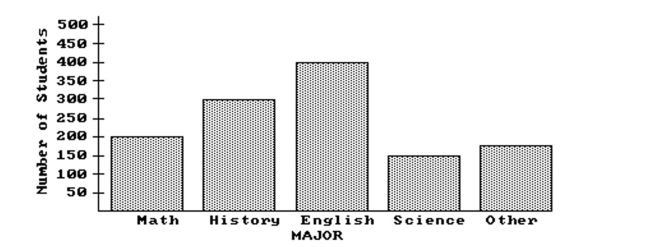 How many students are in the College of Arts and Sciences?
(Multiple Choice)
4.8/5 (39)
Construct the requested statistical display.
-Kevin asked some of his friends how many hours they worked during the previous week at their after-school jobs. Make a frequency table for the data. 5 6 5 3 5 5 9 7 5 3 7 6 7 5 6 7 5 6 7 6 7 7
Hours Tally Frequency 3-4 5-6 7-8 9-10
(Multiple Choice)
4.7/5 (32)
Use the circle graph to solve the problem.
-In a school survey, students showed these preferences for instructional materials. 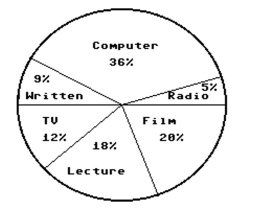 About how many students would you expect to prefer written materials in a school of 450 students?
(Multiple Choice)
4.8/5 (29)
Use the statistical display to answer the question.
-The midterm test scores for the seventh-period typing class are shown below on a dot plot. 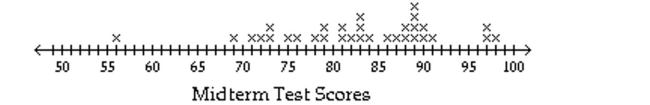 What is the most frequent score?
(Multiple Choice)
4.8/5 (35)
Use the figure to answer the question.
-The average amount of weekend television viewing of high school students is shown below in a frequency table. Frequency Distribution Table Hours Tally Frequency 3-4.5 I I I I I 5 5-6.5 I I I I 4 7-8.5 I I I I I I 7 9-10 I I 2 Total =20 To the nearest half hour, what is the most common amount of weekend television viewing?
(Multiple Choice)
4.9/5 (30)
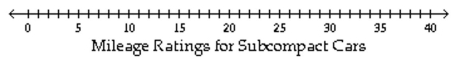
Construct the requested statistical display.
-The mileage ratings for city driving of various subcompact cars are listed below. Construct a line plot using the data. 27 28 10 26 34 27 21 20 19 25 17 29
28 13 23 38 19 32 25 14 11 21 28 24
(Multiple Choice)
4.8/5 (37)
Construct the requested statistical display.
-The one-day temperatures for 12 world cities along with their latitudes are shown in the table below. Make a scatterplot for the data. 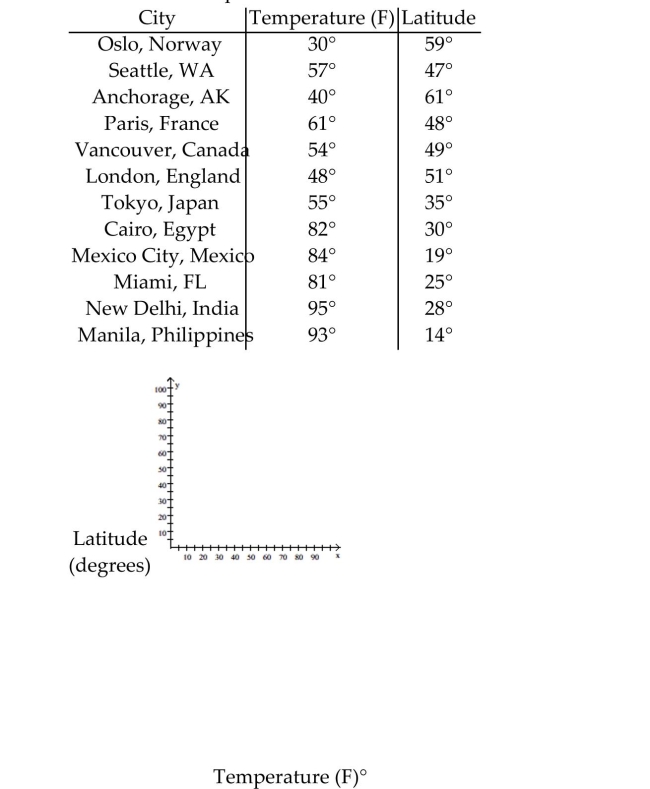
(Essay)
4.8/5 (37)
Use the figure to answer the question.
-The sales figures for the Big "D" Company are shown below in a line graph. 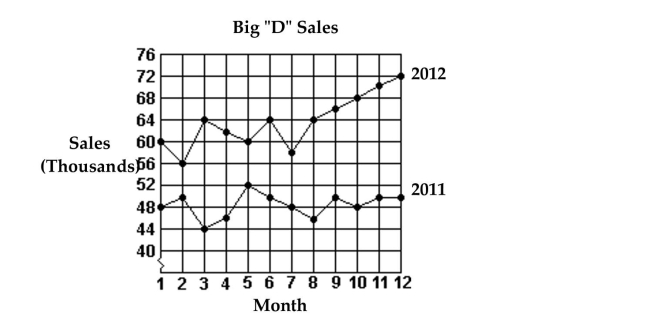 Which month in 2011 had the lowest sales?
(Multiple Choice)
4.9/5 (32)
Construct the requested statistical display.
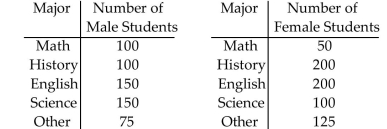
-The numbers of male and female students in the College of Arts and Sciences are listed below by Make a double bar graph for the data.
(Multiple Choice)
4.7/5 (29)
Use the statistical display to answer the question.
-Marriage Licenses Issued
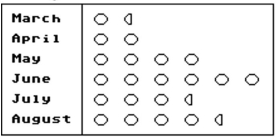 (Each Orepresents 20,000 licenses)
Which months differ the least in the number of licenses issued and by how much?
(Each Orepresents 20,000 licenses)
Which months differ the least in the number of licenses issued and by how much?
(Multiple Choice)
4.8/5 (31)
Use the figure to answer the question.
-The numbers of students in the College of Arts and Sciences, categorized by major, are listed
below. Make a bar graph for the data. 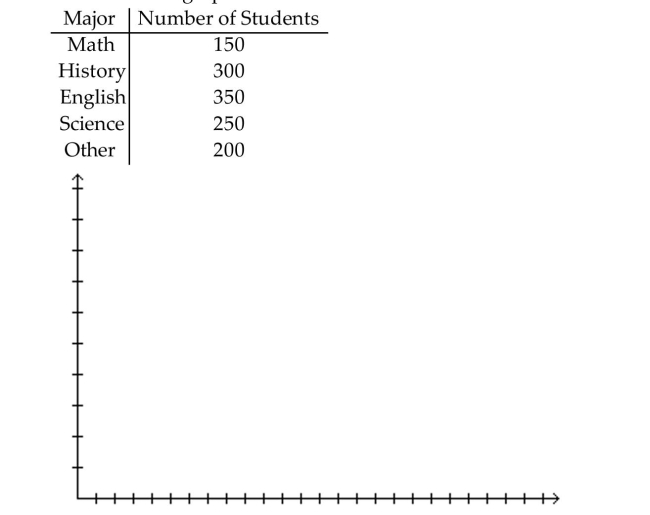
(Essay)
4.7/5 (41)
Use the statistical display to answer the question.
-Marriage Licenses Issued
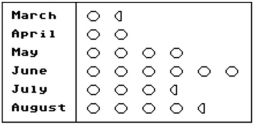 (Each Orepresents 20,000 licenses)
How many licenses are issued in July?
(Each Orepresents 20,000 licenses)
How many licenses are issued in July?
(Multiple Choice)
4.8/5 (34)
Use the figure to answer the question.
-This double-bar graph shows the number of male (M)and female (F)athletes at a university over a four-year period. 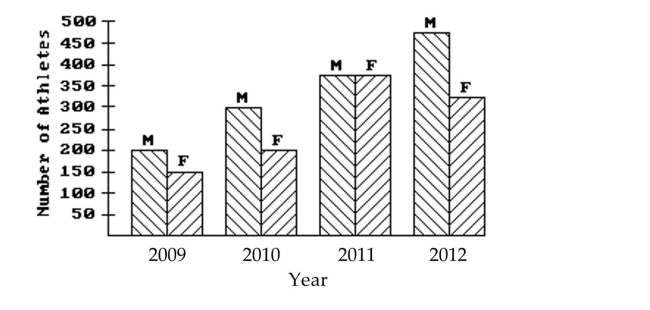 Which year had the greatest number of male athletes?
(Multiple Choice)
4.8/5 (29)
Construct the requested statistical display.
-The weights of 22 members of the varsity football team are listed below. Draw an ordered stem-and-leaf plot for the data. 144 152 142 151 160 152 131 164 141 153 144 175 156 147 133 172 159 135 159 148 140 171
Weights of 22 Members of the Varsity Football Team

(Multiple Choice)
4.8/5 (31)
Identify whether the given scatterplot shows a positive association, negative association, or no association.
-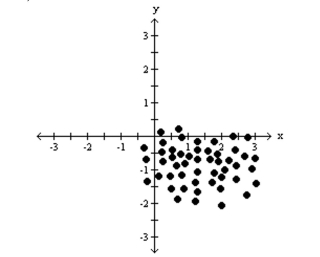
(Multiple Choice)
4.8/5 (39)
Use the circle graph to solve the problem.
-In a school survey, students showed these preferences for instructional materials. 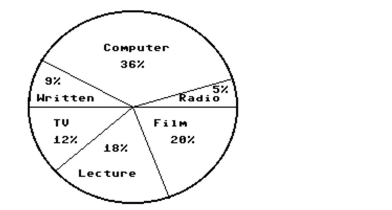 About how many students would you expect to prefer lectures in a school of 750 students?
(Multiple Choice)
4.8/5 (41)
Filters
- Essay(0)
- Multiple Choice(0)
- Short Answer(0)
- True False(0)
- Matching(0)