Exam 10: Estimation and Hypothesis Testing for Two Population Parameters
Exam 1: The Where, Why, and How of Data Collection167 Questions
Exam 2: Graphs, Charts and Tablesdescribing Your Data138 Questions
Exam 3: Describing Data Using Numerical Measures138 Questions
Exam 4: Introduction to Probability125 Questions
Exam 5: Discrete Probability Distributions161 Questions
Exam 6: Introduction to Continuous Probability Distributions122 Questions
Exam 7: Introduction to Sampling Distributions136 Questions
Exam 8: Estimating Single Population Parameters174 Questions
Exam 9: Introduction to Hypothesis Testing183 Questions
Exam 10: Estimation and Hypothesis Testing for Two Population Parameters121 Questions
Exam 11: Hypothesis Tests and Estimation for Population Variances69 Questions
Exam 12: Analysis of Variance162 Questions
Exam 13: Goodness-Of-Fit Tests and Contingency Analysis105 Questions
Exam 14: Introduction to Linear Regression and Correlation Analysis139 Questions
Exam 15: Multiple Regression Analysis and Model Building148 Questions
Exam 16: Analyzing and Forecasting Time-Series Data131 Questions
Exam 17: Introduction to Nonparametric Statistics103 Questions
Exam 18: Introducing Business Analytics48 Questions
Exam 19: Introduction to Decision Analysis48 Questions
Exam 20: Introduction to Quality and Statistical Process Control42 Questions
Select questions type
A pet food producer manufactures and then fills 25-pound bags of dog food on two different production lines located in separate cities. In an effort to determine whether differences exist between the average fill rates for the two lines, a random sample of 19 bags from line 1 and a random sample of 23 bags from line 2 were recently selected. Each bag's weight was measured and the following summary measures from the samples are reported: 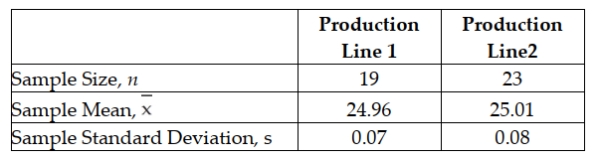 Management believes that the fill rates of the two lines are normally distributed with equal variances. Develop a 95% confidence interval estimate of the true mean difference between the two lines.
(Multiple Choice)
4.9/5  (31)
(31)
In estimating the difference between two population means, if a 95 percent confidence interval includes zero, then we can conclude that there is a 95 percent chance that the difference between the two population means is zero.
(True/False)
4.8/5 (29)
To find the pooled standard deviation involves taking a weighted average of the two sample variances, then finding its square root.
(True/False)
4.7/5 (42)
To increase productivity, workers went through a training program. The management wanted to know the effectiveness of the program. A sample of seven workers was taken and their daily production rates before and after the training are shown below. 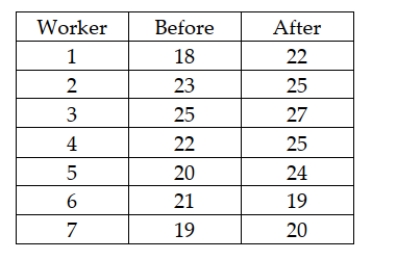 Based on the data, the training program is:
(Multiple Choice)
4.7/5 (37)
In estimating a confidence interval for the difference between two means, when the samples are independent and the standard deviations are unknown, it can be acceptable for there to be small violations of the assumptions of normality and equal variances, especially when the sample sizes are equal.
(True/False)
5.0/5 (31)
A decision maker wishes to test the following null and alternative hypotheses using an alpha level equal to 0.05: H0 : μ1 - μ2 = 0 HA : μ1 - μ2 ≠ 0 The population standard deviations are assumed to be known. After collecting the sample data, the test statistic is computed to be z = 1.78 Using the test statistic approach, what conclusion should be reached about the null hypothesis?
(Multiple Choice)
4.8/5 (41)
A major U.S. oil company has developed two blends of gasoline. Managers are interested in determining whether a difference in mean gasoline mileage will be obtained from using the two blends. As part of their study, they have decided to run a test using the Chevrolet Impala automobile with automatic transmissions. They selected a random sample of 100 Impalas using Blend 1 and another 100 Impalas using Blend 2. Each car was first emptied of all the gasoline in its tank and then filled with the designated blend of the new gasoline. The car was then driven 200 miles on a specified route involving both city and highway roads. The cars were then filled and the actual miles per gallon were recorded. The following summary data were recorded: 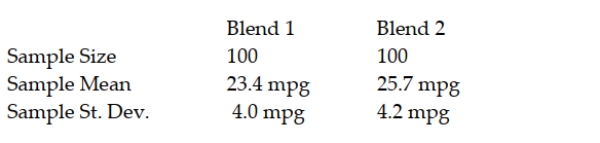 Based on the sample data, using a 0.05 level of significance, what conclusion should the company reach about whether the population mean mpg is the same or different for the two blends? Use the test statistic approach to test the null hypothesis.
(Essay)
4.7/5 (28)
A direct retailer that sells clothing on the Internet has two distribution centers and wants to determine if there is a difference between the proportion of customer order shipments that contain errors (wrong color, wrong size, etc.). It takes a sample of orders from each distribution center and obtain the following results: 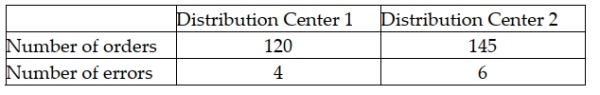 Based on these data it can proceed with assuming the normal distribution for each of the proportion sampling distributions.
(True/False)
4.8/5 (29)
An advertising company has developed a new ad for one of the national car manufacturing companies. The ad agency is interested in testing whether the proportion of favorable response to the ad is the same between male adults versus female adults. It plans on conducting the test using an alpha level equal to 0.05. A sample of 100 adults of each gender will be used in the study. Each person will be asked to view the ad and indicate whether they find the ad to be "pleasing" or not. Given this information, what is the critical value?
(Multiple Choice)
4.9/5 (30)
The Sergio Lumber Company manufactures plywood. One step in the process is the one where the veneer is dried by passing through a huge dryer (similar to an oven) where much of the moisture in the veneer is extracted. At the end of this step, samples of veneer are tested for moisture content. It is believed that pine veneer will be less moist on average than will fir veneer. The following data were reported recently where the values represent the percent moisture in the wood: 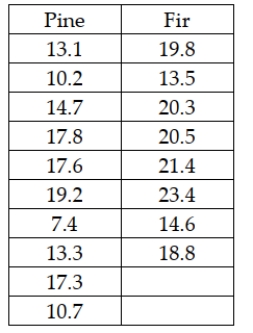 Based on these data, the critical t value from the t-distribution will be 1.7459 if the significance level is set at 0.05 and variances are presumed equal.
(True/False)
4.8/5 (34)
Suppose as part of a national study of economic competitiveness a marketing research firm randomly sampled 200 adults between the ages of 27 and 35 living in metropolitan Seattle and 180 adults between the ages of 27 and 35 living in metropolitan Minneapolis. Each adult selected in the sample was asked, among other things, whether they had a college degree. From the Seattle sample 66 adults answered yes and from the Minneapolis sample 63 adults answered yes when asked if they had a college degree. Based on the sample data, can we conclude that there is a difference between the population proportions of adults between the ages of 27 and 35 in the two cities with college degrees? Use a level of significance of 0.10 to conduct the appropriate hypothesis test.
(Multiple Choice)
4.9/5 (43)
A decision maker wishes to test the following null and alternative hypotheses using an alpha level equal to 0.05: H0 : μ1 - μ2 = 0 HA : μ1 - μ2 ≠ 0 The population standard deviations are assumed to be known. After collecting the sample data, the test statistic is computed to be z = 1.78 Using the p-value approach, what decision should be reached about the null hypothesis?
(Multiple Choice)
4.9/5 (39)
In order to test the difference in populations means, samples were collected for two independent populations where the variances are assumed equal and the population normally distributed. The following data resulted: 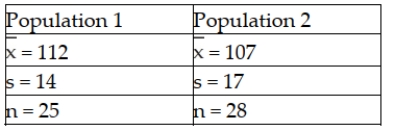 The value of the pooled standard deviation is 15.66.
(True/False)
4.8/5 (36)
A maker of toothpaste is interested in testing whether the proportion of adults (over age 18) who use its toothpaste and have no cavities within a six-month period is any different from the proportion of children (18 and under) who use the toothpaste and have no cavities within a six-month period. To test this, it has selected a sample of adults and a sample of children randomly from the population of those customers who use their toothpaste. The following results were observed. 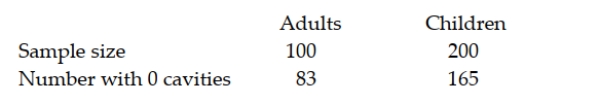 Based on these sample data and using a significance level of 0.05, what conclusion should be reached? Use the p-value approach to conduct the test.
(Essay)
5.0/5 (33)
If we are testing for the difference between the means of two paired populations with samples of n1 = 20 and n2 = 20, the number of degrees of freedom is equal to:
(Multiple Choice)
4.8/5 (34)
Given the following null and alternative hypotheses H0 : μ1 - μ2 = 0 HA : μ1 - μ2 ≠ 0 Together with the following sample information 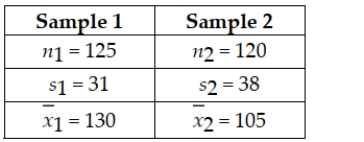 Test the null hypothesis and indicate whether the sample information leads you to reject or fail to reject the null hypothesis, assuming a significance level of 0.05 is to be used. Use the test statistic approach.
(Multiple Choice)
4.8/5 (36)
If the sample data lead us to suspect that the variances of the two populations are not equal, the t-test statistic and the degrees of freedom must be adjusted accordingly.
(True/False)
4.8/5 (28)
When estimating a confidence interval for the difference between 2 means using the method where sample variances are pooled, which of the following assumptions is not needed?
(Multiple Choice)
4.9/5 (33)
Suppose that two population proportions are being compared to test whether there is any difference between them. Assume that the test statistic has been calculated to be z = 2.21. Find the p-value for this situation.
(Multiple Choice)
4.9/5 (30)
The U.S. Golf Association provides a number of services for its members. One of these is the evaluation of golf equipment to make sure that the equipment satisfies the rules of golf. For example, they regularly test the golf balls made by the various companies that sell balls in the United States. Recently they undertook a study of two brands of golf balls with the objective to see whether there is a difference in the mean distance that the two golf ball brands will fly off the tee. To conduct the test, the U.S.G.A. uses a robot named "Iron Byron," which swings the club at the same speed and with the same swing pattern each time it is used. The following data reflect sample data for a random sample of balls of each brand.  Given this information, what is the test statistic for testing whether the two population means are equal?
(Multiple Choice)
4.9/5 (33)
Filters
- Essay(0)
- Multiple Choice(0)
- Short Answer(0)
- True False(0)
- Matching(0)