Exam 10: Estimation and Hypothesis Testing for Two Population Parameters
Exam 1: The Where, Why, and How of Data Collection167 Questions
Exam 2: Graphs, Charts and Tablesdescribing Your Data138 Questions
Exam 3: Describing Data Using Numerical Measures138 Questions
Exam 4: Introduction to Probability125 Questions
Exam 5: Discrete Probability Distributions161 Questions
Exam 6: Introduction to Continuous Probability Distributions122 Questions
Exam 7: Introduction to Sampling Distributions136 Questions
Exam 8: Estimating Single Population Parameters174 Questions
Exam 9: Introduction to Hypothesis Testing183 Questions
Exam 10: Estimation and Hypothesis Testing for Two Population Parameters121 Questions
Exam 11: Hypothesis Tests and Estimation for Population Variances69 Questions
Exam 12: Analysis of Variance162 Questions
Exam 13: Goodness-Of-Fit Tests and Contingency Analysis105 Questions
Exam 14: Introduction to Linear Regression and Correlation Analysis139 Questions
Exam 15: Multiple Regression Analysis and Model Building148 Questions
Exam 16: Analyzing and Forecasting Time-Series Data131 Questions
Exam 17: Introduction to Nonparametric Statistics103 Questions
Exam 18: Introducing Business Analytics48 Questions
Exam 19: Introduction to Decision Analysis48 Questions
Exam 20: Introduction to Quality and Statistical Process Control42 Questions
Select questions type
To test whether Model A and Model B cars have the same MPG, the first step is to select two independent random samples of drivers and assign one of them to drive Model A and the other Model B.
(True/False)
4.8/5  (40)
(40)
Given the following null and alternative hypotheses H0 : μ1 ≥ μ2 HA : μ1 < μ2 Together with the following sample information 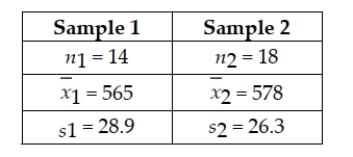 Assuming that the populations are normally distributed with equal variances, test at the 0.05 level of significance whether you would reject the null hypothesis based on the sample information. Use the test statistic approach.
(Multiple Choice)
4.8/5 (31)
A commuter has two different routes available to drive to work. She wants to test whether route A is faster than route B. The best hypotheses are:
(Multiple Choice)
4.8/5 (35)
A major retail clothing store is interested in estimating the difference in mean monthly purchases by customers who use the store's in-house credit card versus using a Visa, Mastercard, or one of the other major credit cards. To do this, it has randomly selected a sample of customers who have made one or more purchases with each of the types of credit cards. The following represents the results of the sampling: 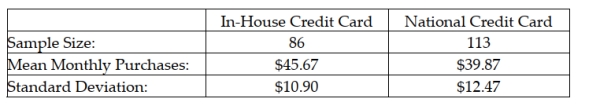 Given this information, which of the following statements is true?
(Multiple Choice)
5.0/5 (42)
The management of a department store is interested to estimate the difference in the amount of money spent by female and male shoppers. You are given the following information. 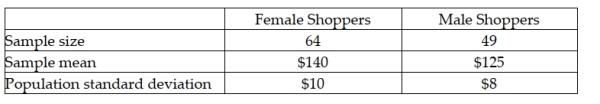 A 95 percent confidence interval estimate for the difference between the average purchases of the customers using the two different credit cards is:
(Multiple Choice)
4.9/5 (39)
You are given the following results of a paired-difference test: 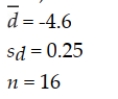 Construct a 90% confidence interval estimate for the paired difference in mean values.
(Multiple Choice)
4.7/5 (27)
The following paired samples have been obtained from normally distributed populations. Construct a 90% confidence interval estimate for the mean paired difference between the two population means. 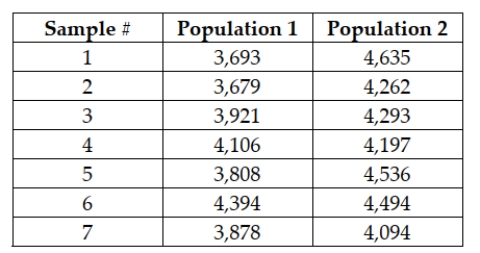
(Multiple Choice)
4.8/5 (30)
There is interest at the American Savings and Loan as to whether there is a difference between average daily balances in checking accounts that are joint accounts (two or more members per account) versus single accounts (one member per account). To test this, a random sample of checking accounts was selected with the following results: 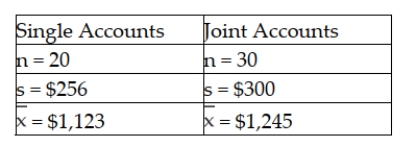 Based upon these data, the critical value from the t-distribution for testing the difference between the two population means using a significance level of 0.05 is t = 1.6772.
(True/False)
4.8/5 (37)
Most companies that make golf balls and golf clubs use a one-armed robot named "Iron Byron" to test their balls for length and accuracy, but because of swing variations by real golfers, these test robots don't always indicate how the clubs will perform in actual use. One company in the golfing industry is interested in testing its new driver to see if has greater length off the tee than the best-selling driver. To do this, it has selected a group of golfers of differing abilities and ages. Its plan is to have each player use each of the two clubs and hit five balls. It will record the average length of the drives with each club for each player. The resulting data for a sample of 10 players is: 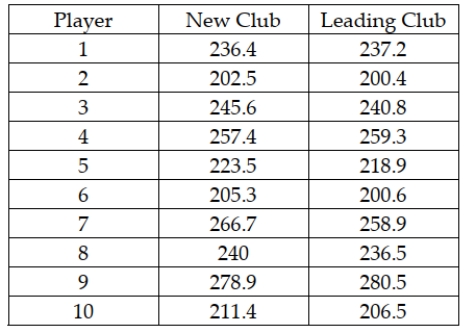 Based on these sample data, what is the point estimate for the difference between the mean distance for the new driver versus the leading driver?
(Multiple Choice)
4.8/5 (31)
A major manufacturer of home electronics is interested in determining whether customers have a preference between two new speaker designs for their home entertainment centers. To test this, the design department manager has selected a random sample of customers and shown them the first design. A second sample of customers is shown design 2. The manager then asks each customer whether they prefer the new design they were shown over the one they currently own. The following results were observed: 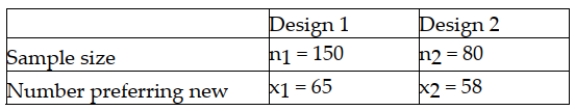 Based on these data and a significance level equal to 0.05, the test statistic is approximately -4.22 and thus the null hypothesis should be rejected.
(True/False)
4.8/5 (48)
A real estate agent believes that home with swimming pools take longer to sell than home without swimming pools. A random sample of each type of recently sold homes was taken where the number of days on the market is recorded. Results are: 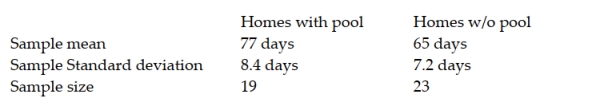 Assuming that the populations are normally distributed and the variances are equal, conduct the appropriate hypothesis test to determine if the real estate agent is correct. Use the 0.05 level of significance.
(Essay)
4.7/5 (31)
A major manufacturer of home electronics is interested in determining whether customers have a preference between two new speaker designs for their home entertainment centers. To test this, the design department manager has selected a random sample of customers and shown them the first design. A second sample of customers is shown design 2. The manager then asks each customer whether they prefer the new design they were shown over the one they currently own. The following results were observed: 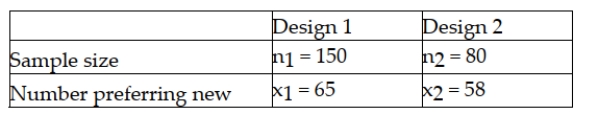 Based on these data and a significance level equal to 0.05, the appropriate null and alternative hypotheses are: H0 : 1 ≥ 2 Ha : 1 < 2
(True/False)
4.8/5 (35)
Marketing managers for a toy store located in two separate cities is interested in estimating the difference in the mean daily sales for the two cities. They want to calculate a 90 percent confidence interval and will select a sample of 10 days in each store for the study. If the marketing managers assume that the population standard deviations are known, the critical value for the confidence interval is z = 1.645.
(True/False)
4.8/5 (44)
A company in Maryland has developed a device that can be attached to car engines, which it believes will increase the miles per gallon that cars will get. The owners are interested in estimating the difference between mean mpg for cars using the device versus those that are not using the device. The following data represent the mpg for independent random samples of cars from each population. The variances are assumed equal and the populations normally distributed. 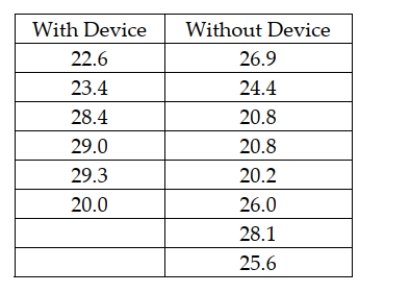 Given this data, what is the critical value if the owners wish to have a 90 percent confidence interval estimate?
(Multiple Choice)
4.8/5 (38)
If we are testing for the difference between the means of two independent populations with samples of n1 = 20 and n2 = 20, the number of degrees of freedom is equal to:
(Multiple Choice)
4.8/5 (38)
Suppose a survey is taken of two groups of people where each person is asked a yes/no question and the proportion of people who answer yes is calculated for each group. Which of the following is true about a hypothesis test of the difference in the two proportions?
(Multiple Choice)
4.9/5 (39)
A study was recently conducted at a major university to determine whether there is a difference in the proportion of business school graduates who go on to graduate school within five years after graduation and the proportion of non-business school graduates who attend graduate school. A random sample of 400 business school graduates showed that 75 had gone to graduate school while in a random sample of 500 non-business graduates, 137 had gone on to graduate school. Based on these sample data, and testing at the 0.10 level of significance, what is the value of the test statistic?
(Multiple Choice)
4.8/5 (40)
Given the following null and alternative hypotheses H0 : μ1 - μ2 = 0 HA : μ1 - μ2 ≠ 0 Together with the following sample information 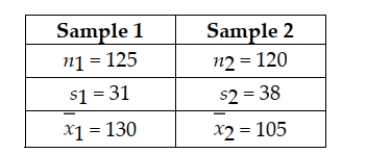 Develop the appropriate decision rule, assuming a significance level of 0.05 is to be used.
(Multiple Choice)
4.7/5 (25)
When performing a hypothesis test for the difference between the means of two independent populations where the standard deviations are known, it is necessary to use the pooled standard deviation in calculating the test statistic.
(True/False)
4.8/5 (33)
In order to make the test for the difference between two population means valid, the sample size in each independent sample must be the same.
(True/False)
4.8/5 (30)
Filters
- Essay(0)
- Multiple Choice(0)
- Short Answer(0)
- True False(0)
- Matching(0)