Exam 10: Estimation and Hypothesis Testing for Two Population Parameters
Exam 1: The Where, Why, and How of Data Collection167 Questions
Exam 2: Graphs, Charts and Tablesdescribing Your Data138 Questions
Exam 3: Describing Data Using Numerical Measures138 Questions
Exam 4: Introduction to Probability125 Questions
Exam 5: Discrete Probability Distributions161 Questions
Exam 6: Introduction to Continuous Probability Distributions122 Questions
Exam 7: Introduction to Sampling Distributions136 Questions
Exam 8: Estimating Single Population Parameters174 Questions
Exam 9: Introduction to Hypothesis Testing183 Questions
Exam 10: Estimation and Hypothesis Testing for Two Population Parameters121 Questions
Exam 11: Hypothesis Tests and Estimation for Population Variances69 Questions
Exam 12: Analysis of Variance162 Questions
Exam 13: Goodness-Of-Fit Tests and Contingency Analysis105 Questions
Exam 14: Introduction to Linear Regression and Correlation Analysis139 Questions
Exam 15: Multiple Regression Analysis and Model Building148 Questions
Exam 16: Analyzing and Forecasting Time-Series Data131 Questions
Exam 17: Introduction to Nonparametric Statistics103 Questions
Exam 18: Introducing Business Analytics48 Questions
Exam 19: Introduction to Decision Analysis48 Questions
Exam 20: Introduction to Quality and Statistical Process Control42 Questions
Select questions type
There have been complaints recently from homeowners in the north end claiming that their homes have been assessed at values that are too high compared with other parts of town. They say that the mean increase from last year to this year has been higher in their part of town than elsewhere. To test this, the assessor's office staff plans to select a random sample of north end properties (group 1) and a random sample of properties from other areas within the city (group 2) and perform a hypothesis test. Based on the information provided, the research (or alternate) hypothesis is:
(Multiple Choice)
4.8/5  (34)
(34)
Assume that you are testing the difference in the means of two independent populations at the 0.05 level of significance. The null hypothesis is: H0 : μA - μβ ≥ 0 and you have found the test statistic is What should you conclude?
(Multiple Choice)
4.7/5 (25)
There are a number of highly touted search engines for finding things of interest on the Internet. Recently, a consumer rating system ranked two search engines ahead of the others. Now, a computer user's magazine wishes to make the final determination regarding which one is actually better at finding particular information. To do this, each search engine was used in an attempt to locate specific information using specified keywords. Both search engines were subjected to 100 queries. Search engine 1 successfully located the information 88 times and search engine 2 located the information 80 times. Using a significance level equal to 0.05, what is the critical value for the hypothesis test?
(Multiple Choice)
4.8/5 (33)
Given the following information, calculate the degrees of freedom that should be used in the pooled- standard deviation t-test.
(Multiple Choice)
4.8/5 (35)
An accounting firm has been hired by a large computer company to determine whether the proportion of accounts receivables with errors in one division (Division 1) exceeds that of the second division (Division 2). The managers believe that such a difference may exist because of the lax standards employed by the first division. To conduct the test, the accounting firm has selected random samples of accounts from each division with the following results. 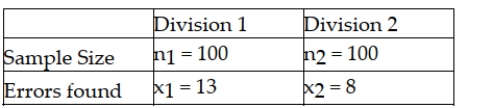 Based on this information and using a significance level equal to 0.05, the test statistic for the hypothesis test is approximately 1.153 and, therefore, the null hypothesis is not rejected.
(True/False)
4.8/5 (24)
The NCAA is interested in estimating the difference in mean number of daily training hours for men and women athletes on college campuses. It wants 95 percent confidence and will select a sample of 10 men and 10 women for the study. The variances are assumed equal and the populations normally distributed. The sample results are: 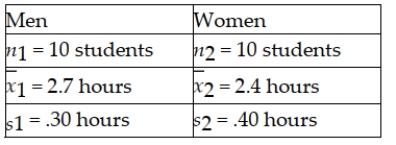 Based on these data, the lower limit for the difference between population means is 0.15 hours.
(True/False)
4.7/5 (35)
A major U.S. oil company has developed two blends of gasoline. Managers are interested in estimating the difference in mean gasoline mileage that will be obtained from using the two blends. As part of their study, they have decided to run a test using the Chevrolet Impala automobile with automatic transmissions. They selected a random sample of 100 Impalas using Blend 1 and another 100 Impalas using Blend 2. Each car was first emptied of all the gasoline in its tank and then filled with the designated blend of the new gasoline. The car was then driven 200 miles on a specified route involving both city and highway roads. The cars were then filled and the actual miles per gallon were recorded. The following summary data were recorded: 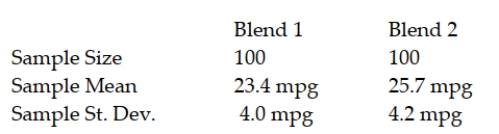 Based on these sample data, compute and interpret the 95 percent confidence interval estimate for the difference in mean mpg for the two blends.
(Essay)
4.8/5 (24)
A PC company uses two suppliers for rechargeable batteries for its notebook computers. Two factors are important quality features of the batteries: mean use time and variation. It is desirable that the mean use time be high and the variability be low. Recently, the PC maker conducted a test on batteries from the two suppliers. In the test, 9 randomly selected batteries from Supplier 1 were tested and 12 randomly selected batteries from Supplier 2 were tested. The following results were observed: 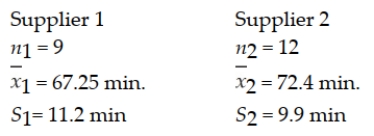 Based on these sample results, can the PC maker conclude that a difference exists between the two batteries with respect to the population mean use time? Test using a 0.10 level of significance.
(Essay)
5.0/5 (42)
You are given the following results of a paired-difference test: 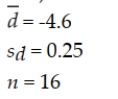 Construct a 99% confidence interval estimate for the paired difference in mean values.
(Multiple Choice)
4.9/5 (34)
A major U.S. oil company has developed two blends of gasoline. Managers are interested in determining whether a difference in mean gasoline mileage will be obtained from using the two blends. As part of their study, they have decided to run a test using the Chevrolet Impala automobile with automatic transmissions. They selected a random sample of 100 Impalas using Blend 1 and another 100 Impalas using Blend 2. Each car was first emptied of all the gasoline in its tank and then filled with the designated blend of the new gasoline. The car was then driven 200 miles on a specified route involving both city and highway roads. The cars were then filled and the actual miles per gallon were recorded. The following summary data were recorded: 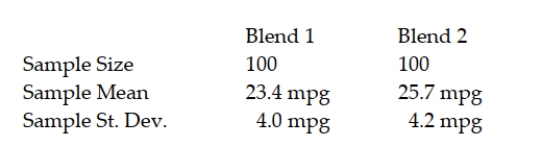 Based on the sample data, using a 0.05 level of significance, what conclusion should the company reach about whether the population mean mpg is the same or different for the two blends? Use the p-value approach to test the null hypothesis.
(Essay)
4.8/5 (31)
A study was recently conducted at a major university to estimate the difference in the proportion of business school graduates who go on to graduate school within five years after graduation and the proportion of non-business school graduates who attend graduate school. A random sample of 400 business school graduates showed that 75 had gone to graduate school while in a random sample of 500 non-business graduates, 137 had gone on to graduate school. Based on a 95 percent confidence level, what is the upper limit of the confidence interval estimate?
(Multiple Choice)
4.9/5 (38)
An accounting firm has been hired by a large computer company to determine whether the proportion of accounts receivables with errors in one division (Division 1) exceeds that of the second division (Division 2). The managers believe that such a difference may exist because of the lax standards employed by the first division. The null and alternative hypotheses that will be tested are: H0 : μ1 ≥ μ2 Ha : μ1 < μ2
(True/False)
4.8/5 (33)
An accounting firm has been hired by a large computer company to determine whether the proportion of accounts receivables with errors in one division (Division 1) exceeds that of the second division (Division 2). The managers believe that such a difference may exist because of the lax standards employed by the first division. To conduct the test, the accounting firm has selected random samples of accounts from each division with the following results. 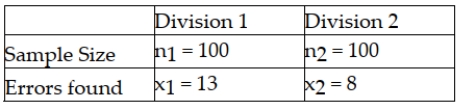 Based on this information and using a significance level equal to 0.05, the critical value from the standard normal table is z = 1.645.
(True/False)
4.9/5 (32)
The Cranston Hardware Company is interested in estimating the difference in the mean purchase for men customers versus women customers. It wishes to estimate this difference using a 95 percent confidence level. If the sample size is n = 10 from each population, the samples are independent, and sample standard deviations are used, and the variances are assumed equal, then the critical value will be t = 2.1009.
(True/False)
4.9/5 (36)
The Sergio Lumber Company manufactures plywood. One step in the process is the one where the veneer is dried by passing through a huge dryer (similar to an oven) where much of the moisture in the veneer is extracted. At the end of this step, samples of veneer are tested for moisture content. It is believed that pine veneer will be less moist on average than will fir veneer. The hypothesis test that will be conducted using an alpha = 0.05 level will be a two-tailed test.
(True/False)
4.9/5 (35)
The management of the Seaside Golf Club regularly monitors the golfers on its course for speed of play. Suppose a random sample of golfers was taken in 2011 and another random sample of golfers was selected in 2006. The results of the two samples are as follows: 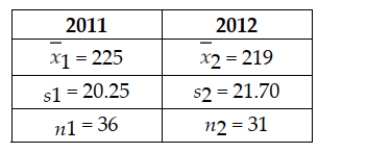 Based on the sample results, can the management of the Seaside Golf Club conclude that average speed of play was different in 2012 than in 2011? Conduct the appropriate hypothesis test at the 0.10 level of significance. Assume that the management of the club is willing to accept the assumption that the populations of playing times for each year are approximately normally distributed with equal variances.
(Multiple Choice)
4.9/5 (34)
A direct retailer that sells clothing on the Internet has two distribution centers and wants to determine if there is a difference between the proportion of customer order shipments that contain errors (wrong color, wrong size, etc.). It calculates a 95 percent confidence interval on the difference in the sample proportions to be -0.012 to 0.037. Based on this, it can conclude that the distribution centers differ significantly for the proportion of orders with errors.
(True/False)
4.8/5 (31)
There is interest at the American Savings and Loan as to whether there is a difference between average daily balances in checking accounts that are joint accounts (two or more members per account) versus single accounts (one member per account). To test this, a random sample of checking accounts was selected with the following results: 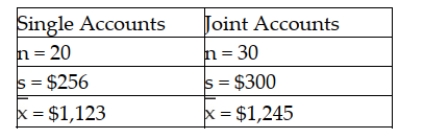 Based upon these data, assuming that the populations are normally distributed with equal variances, the test statistic for testing whether the two populations have equal means is approximately -1.49.
(True/False)
4.9/5 (37)
In an article entitled "Childhood Pastimes Are Increasingly Moving Indoors," Dennis Cauchon asserts that there have been huge declines in spontaneous outdoor activities such as bike riding, swimming, and touch football. In the article, he cites separate studies by the national Sporting Goods Association and American Sports Data that indicate bike riding alone is down 31% from 1995 to 2004. According to the surveys, 68% of 7- to 11-year-olds rode a bike at least six times in 1995 and only 47% did in 2004. Assume the sample sizes were 1,500 and 2,000, respectively. Calculate a 95% confidence interval to estimate the proportion of 7- to 11-year-olds who rode their bike at least six times in 2004.
(Multiple Choice)
4.8/5 (32)
There have been complaints recently from homeowners in the north end claiming that their homes have been assessed at values that are too high compare with other parts of town. They say that the mean increase from last year to this year has been higher in their part of town than elsewhere. To test this, the assessor's office staff plans to select a random sample of north end properties (group 1) and a random sample of properties from other areas within the city (group 2) and perform a hypothesis test. The following sample information is available: 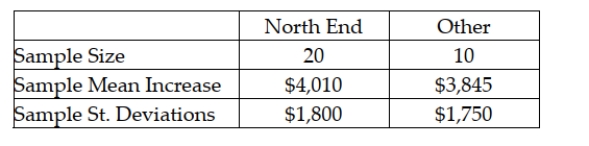 Assuming that the null hypothesis will be tested using an alpha level equal to 0.05, what is the critical value?
(Multiple Choice)
4.7/5 (42)
Filters
- Essay(0)
- Multiple Choice(0)
- Short Answer(0)
- True False(0)
- Matching(0)