Exam 10: Estimation and Hypothesis Testing for Two Population Parameters
Exam 1: The Where, Why, and How of Data Collection167 Questions
Exam 2: Graphs, Charts and Tablesdescribing Your Data138 Questions
Exam 3: Describing Data Using Numerical Measures138 Questions
Exam 4: Introduction to Probability125 Questions
Exam 5: Discrete Probability Distributions161 Questions
Exam 6: Introduction to Continuous Probability Distributions122 Questions
Exam 7: Introduction to Sampling Distributions136 Questions
Exam 8: Estimating Single Population Parameters174 Questions
Exam 9: Introduction to Hypothesis Testing183 Questions
Exam 10: Estimation and Hypothesis Testing for Two Population Parameters121 Questions
Exam 11: Hypothesis Tests and Estimation for Population Variances69 Questions
Exam 12: Analysis of Variance162 Questions
Exam 13: Goodness-Of-Fit Tests and Contingency Analysis105 Questions
Exam 14: Introduction to Linear Regression and Correlation Analysis139 Questions
Exam 15: Multiple Regression Analysis and Model Building148 Questions
Exam 16: Analyzing and Forecasting Time-Series Data131 Questions
Exam 17: Introduction to Nonparametric Statistics103 Questions
Exam 18: Introducing Business Analytics48 Questions
Exam 19: Introduction to Decision Analysis48 Questions
Exam 20: Introduction to Quality and Statistical Process Control42 Questions
Select questions type
The American College Health Association produced the National College Health Assessment (Andy Gardiner, "Surfacing from Depression," February 6, 2006). The assessment indicates that the percentage of U.S. college students who report having been diagnosed with depression has risen from 2000. The assessment surveyed 47,202 students at 74 campuses. It discovered that 10.3% and 14.9% of students indicated that they had been diagnosed with depression in 2000 and 2004, respectively. Assume that half of the students surveyed were surveyed in 2004. Indicate the margin of error for estimating p1 - p2 with 1 - 2.
(Multiple Choice)
4.8/5  (31)
(31)
Two placement exams are available that students can take to determine which math class they should begin with in their freshman year. It is believed that there is no difference in the mean scores that would be received for the two tests. To test this using a 0.05 level of significance, a randomly selected group of students took both tests and had their scores recorded. The following data were obtained: 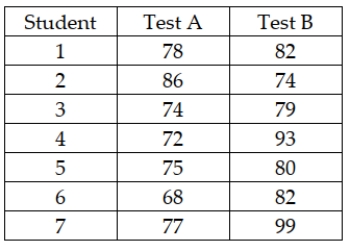 Based on these data, the test statistic is approximately t = -1.892.
(True/False)
4.9/5 (25)
The Cranston Hardware Company is interested in estimating the difference in the mean purchase for men customers versus women customers. It wishes to estimate this difference using a 95 percent confidence level. Assume that the variances are equal and the populations normally distributed. The following data represent independent samples from each population: 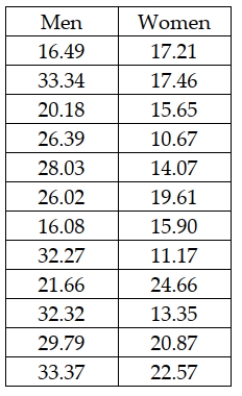 Based on these data, the company can conclude that there is a statistical difference between men and women with regard to mean spending at the hardware store with men tending to spend more on average than women.
(True/False)
4.9/5 (40)
If you are interested in estimating the difference between the means of two samples that have been paired, the point estimate for this difference is the mean value of the paired differences.
(True/False)
4.8/5 (37)
The National Football League (NFL) is interested in testing to see whether there is a difference in the proportion of male fans that prefer instant replay to review officials' calls and the proportion of female fans that prefer instant replay. It is believed that males tend to favor the practice to a higher degree than do females. To test this, random samples of male fans and female fans were selected and the following results were obtained: 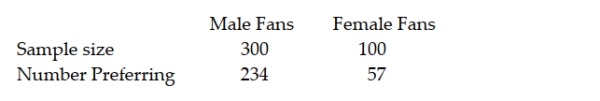 Using a significance level equal to 0.05, what conclusion should be reached based on the sample data?
(Essay)
5.0/5 (38)
Increasing the size of the samples in a study to estimate the difference between two population means will increase the level of confidence that a decision maker can have regarding the interval estimate.
(True/False)
4.9/5 (39)
Suppose that a group of 10 people join a weight loss program for 3 months. Each person's weight is recorded at the beginning and at the end of the 3-month program. To test whether the weight loss program is effective, the data should be treated as:
(Multiple Choice)
4.8/5 (42)
There are a number of highly touted search engines for finding things of interest on the Internet. Recently a consumer rating system ranked two search engines ahead of the others. Now, a computer user's magazine wishes to make the final determination regarding which one is actually better at finding particular information. To do this, each search engine was used in an attempt to locate specific information using specified keywords. Both search engines were subjected to 100 queries. Search engine 1 successfully located the information 88 times and search engine 2 located the information 80 times. Using a significance level equal to 0.05, what is the null hypothesis to be tested?
(Multiple Choice)
4.8/5 (39)
When conducting a hypothesis test to determine whether or not two groups differ, using paired samples rather than independent samples has the advantage of controlling for sources of variation that might distort the conclusions of the study.
(True/False)
4.8/5 (36)
When performing a hypothesis test for the difference between the means of two independent populations, where the standard deviations are known, the variances must be assumed equal.
(True/False)
4.8/5 (35)
The American College Health Association produced the National College Health Assessment (Andy Gardiner, "Surfacing from Depression," February 6, 2006). The assessment indicates that the percentage of U.S. college students who report having been diagnosed with depression has risen from 2000. The assessment surveyed 47,202 students at 74 campuses. It discovered that 10.3% and 14.9% of students indicated that they had been diagnosed with depression in 2000 and 2004, respectively. Assume that half of the students surveyed were surveyed in 2004. Conduct a hypothesis test to determine if there has been more than a 0.04 increase in the proportion of students who indicated they have been diagnosed with depression. Use a significance level of 0.05 and a p-value approach to this test.
(Multiple Choice)
4.8/5 (37)
The Cranston Hardware Company is interested in estimating the difference in the mean purchase for men customers versus women customers. It wishes to estimate this difference using a 95 percent confidence level. Assume that the variances are equal and the populations normally distributed. The following data represent independent samples from each population: 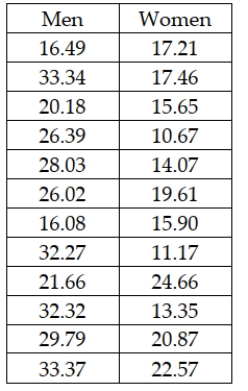 Based on these data, the upper limit of the interval estimate is approximately $13.82.
(True/False)
4.8/5 (35)
The t-distribution can be used to test hypotheses about the difference between two population means given the following two assumptions: - each population is normally distributed, and - the two populations have equal variances.
(True/False)
4.7/5 (33)
A company in Maryland has developed a device that can be attached to car engines, which it believes will increase the miles per gallon that cars will get. The owners are interested in estimating the difference between mean mpg for cars using the device versus those that are not using the device. The following data represent the mpg for random independent samples of cars from each population. The variances are assumed equal and the populations normally distributed. 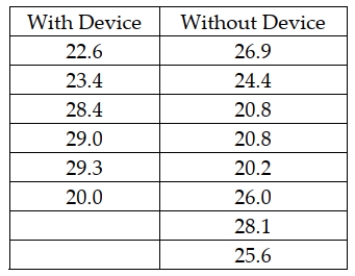 Given this data, what is the upper limit for a 95 percent confidence interval estimate for the difference in mean mpg?
(Multiple Choice)
4.8/5 (37)
The test statistic that is used when testing hypotheses about the difference between two population proportions is the t-value from the t-distribution.
(True/False)
4.8/5 (33)
Most companies that make golf balls and golf clubs use a one-armed robot named "Iron Mike" to test their balls for length and accuracy, but because of swing variations by real golfers, these test robots don't always indicate how the clubs will perform in actual use. One company in the golfing industry is interested in testing its new driver to see if it has greater length off the tee than the best-selling driver. To do this, it has selected a group of golfers of differing abilities and ages. Its plan is to have each player use each of the two clubs and hit five balls. It will record the average length of the drives with each club for each player. The resulting data for a sample of 10 players are: 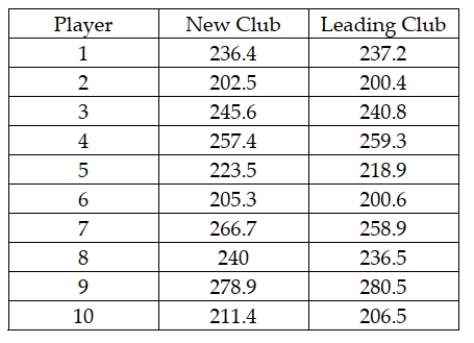 What is the critical value for the appropriate hypothesis test if the test is conducted using a 0.05 level of significance?
(Multiple Choice)
4.9/5 (35)
An accounting firm has been hired by a large computer company to determine whether the proportion of accounts receivables with errors in one division (Division 1) exceeds that of the second division (Division 2). The managers believe that such a difference may exist because of the lax standards employed by the first division. To conduct the test, the accounting firm has selected random samples of accounts from each division with the following results. 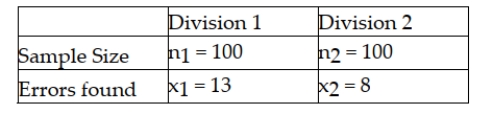 Based on this information, and using a significance level equal to 0.05, the pooled estimator for the overall proportion is = .1050.
(True/False)
4.9/5 (31)
A major retail clothing store is interested in estimating the difference in mean monthly purchases by customers who use the store's in-house credit card versus using a Visa, Mastercard, or one of the other major credit cards. To do this, it has randomly selected a sample of customers who have made one or more purchases with each of the types of credit cards. The following represents the results of the sampling: 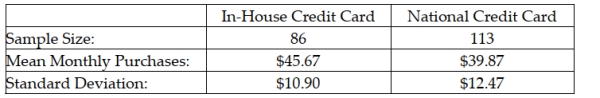 Based on these sample data, what is the lower limit for the 95 percent confidence interval estimate for the difference between population means?
(Multiple Choice)
4.7/5 (38)
The point estimate in a paired difference estimation example is an estimation of the population differences lying halfway between the interval limits of a confidence interval.
(True/False)
4.7/5 (33)
The following samples are observations taken from the same elements at two different times: 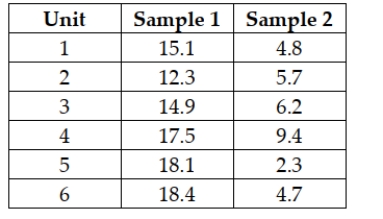 Assume that the populations are normally distributed and construct a 90% confidence interval for the difference in the means of the distribution at the times in which the samples were taken.
(Multiple Choice)
4.9/5 (41)
Filters
- Essay(0)
- Multiple Choice(0)
- Short Answer(0)
- True False(0)
- Matching(0)