Exam 16: Analyzing and Forecasting Time-Series Data
Exam 1: The Where, Why, and How of Data Collection167 Questions
Exam 2: Graphs, Charts and Tablesdescribing Your Data138 Questions
Exam 3: Describing Data Using Numerical Measures138 Questions
Exam 4: Introduction to Probability125 Questions
Exam 5: Discrete Probability Distributions161 Questions
Exam 6: Introduction to Continuous Probability Distributions122 Questions
Exam 7: Introduction to Sampling Distributions136 Questions
Exam 8: Estimating Single Population Parameters174 Questions
Exam 9: Introduction to Hypothesis Testing183 Questions
Exam 10: Estimation and Hypothesis Testing for Two Population Parameters121 Questions
Exam 11: Hypothesis Tests and Estimation for Population Variances69 Questions
Exam 12: Analysis of Variance162 Questions
Exam 13: Goodness-Of-Fit Tests and Contingency Analysis105 Questions
Exam 14: Introduction to Linear Regression and Correlation Analysis139 Questions
Exam 15: Multiple Regression Analysis and Model Building148 Questions
Exam 16: Analyzing and Forecasting Time-Series Data131 Questions
Exam 17: Introduction to Nonparametric Statistics103 Questions
Exam 18: Introducing Business Analytics48 Questions
Exam 19: Introduction to Decision Analysis48 Questions
Exam 20: Introduction to Quality and Statistical Process Control42 Questions
Select questions type
It is possible to conduct a statistical test for autocorrelation using the Durbin-Watson test and not be able to make a definitive conclusion about whether there is autocorrelation or not based on the data.
(True/False)
4.8/5  (29)
(29)
Which of the following forecasting methods allows the decision maker to weigh the past time series differently to make the model more sensitive to more recent data?
(Multiple Choice)
4.8/5 (31)
The Wilson Company is interested in forecasting demand for its XG-667 product for quarter 13 based on 12 quarters of data. The following shows the data and the double exponential smoothing model results for periods 1-12 using alpha = 0.20 and beta = 0.40. 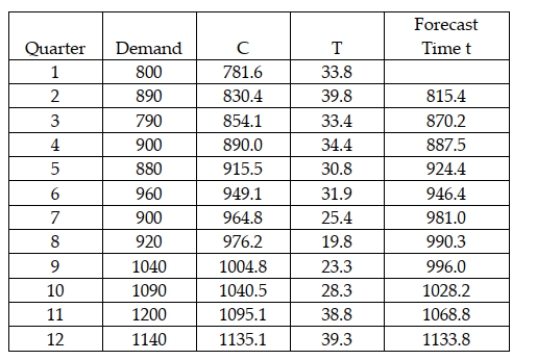 Based on this information, what is the MAD value for quarters 2-12?
(Multiple Choice)
4.9/5 (33)
In comparing two or more forecasting models, the MAD value is useful in determining how successful the models were in fitting historical data.
(True/False)
4.8/5 (37)
If you suspect that your time-series data has a strong downward trend, you should set the beta smoothing constant at value fairly close to negative 1.0
(True/False)
4.7/5 (36)
The Cresswell Company updates its annual sales forecast every month as new sales data becomes available. The one-month update is called:
(Multiple Choice)
4.9/5 (25)
In a single exponential smoothing model, one smoothing constant is used to weigh the historical data, and the model is of primary value when the data do not exhibit trend or seasonal components.
(True/False)
4.8/5 (42)
A time series is shown below. Perform single exponential smoothing for this data set using α = 0.2 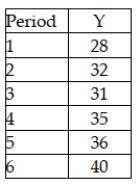 What is the value of the forecast for period 6?
(Multiple Choice)
4.9/5 (34)
The Wilson Company is interested in forecasting demand for its XG-667 product for quarter 13 based on 12 quarters of data. The following shows the data and the double exponential smoothing model results for periods 1-12 using alpha = 0.20 and beta = 0.40. 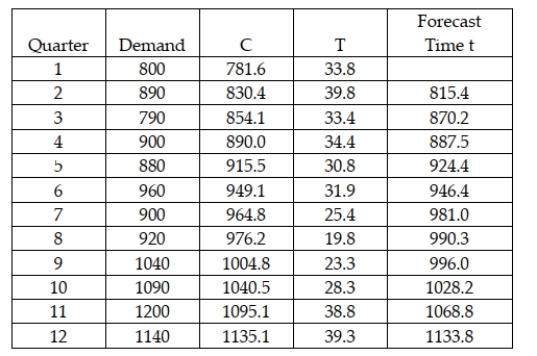 Based on this information, which of the following statements is true?
(Multiple Choice)
4.8/5 (33)
While virtually all time series exhibit a random component, not all time series exhibit other components.
(True/False)
4.8/5 (41)
The owners of Hal's Cookie Company have collected sales data for the past 8 months. These data are shown as follows: 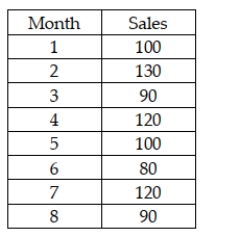 Using a starting forecast in period 1 of 100, the forecast bias over periods 2-8 is negative when a single exponential smoothing model is used with a smoothing constant of 0.20
(True/False)
4.8/5 (34)
The process of selecting the forecasting technique to use in a particular application is called:
(Multiple Choice)
4.7/5 (32)
A company has developed a linear trend model to forecast monthly sales. The following data show the actual sales and the "fitted" sales for months 1-12. 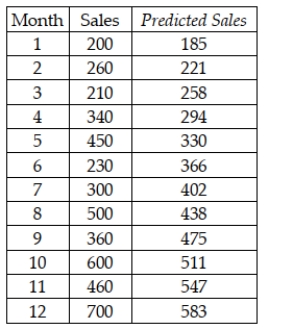 Based on these data, what is the value for the mean absolute deviation for months 1-12?
(Multiple Choice)
4.8/5 (31)
Which of the following approaches might be used to determine which value for the smoothing constant to use in a single exponential smoothing model?
(Multiple Choice)
4.9/5 (36)
The Baker's Candy Company has been in business for three years. The quarterly sales data for the company are shown as follows: 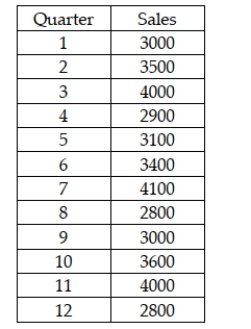 Based on this information, the data reflect both a linear trend and seasonal components.
(True/False)
4.9/5 (38)
A company has a monthly time series that regularly shows sales being higher in the summer months. This is an example of which component?
(Multiple Choice)
4.8/5 (30)
In a time series with monthly sales data, a spring quarter seasonal index of 1.21 can be interpreted to mean that sales tend to be 21 percent higher in the spring quarter when compared to the other quarters.
(True/False)
4.7/5 (34)
The Zocor Company is interested in forecasting period 13 sales for a product. It has 12 months of historical data. The following shows the data and the forecasted valued for periods 1-12 using a single exponential smoothing model with a smoothing constant value equal to 0.20 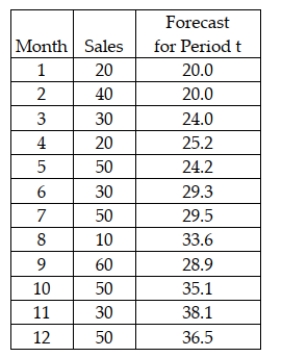 What is the value of the MAD for periods 2-12?
(Multiple Choice)
4.8/5 (32)
A company has developed a linear trend regression model based on 16 quarters of data. The independent variable is the measure of time (t = 1 thru 16 where quarter 1 is winter quarter, 2 is spring, etc.). The company has also developed seasonal indexes for each quarter as follows: 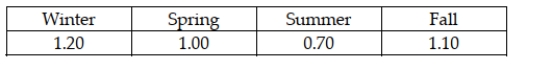 The linear trend forecast equation is: = 120 + 56t. Given this information, what is the seasonally unadjusted forecast for period 19?
(Multiple Choice)
4.8/5 (34)
Filters
- Essay(0)
- Multiple Choice(0)
- Short Answer(0)
- True False(0)
- Matching(0)