Exam 16: Analyzing and Forecasting Time-Series Data
Exam 1: The Where, Why, and How of Data Collection167 Questions
Exam 2: Graphs, Charts and Tablesdescribing Your Data138 Questions
Exam 3: Describing Data Using Numerical Measures138 Questions
Exam 4: Introduction to Probability125 Questions
Exam 5: Discrete Probability Distributions161 Questions
Exam 6: Introduction to Continuous Probability Distributions122 Questions
Exam 7: Introduction to Sampling Distributions136 Questions
Exam 8: Estimating Single Population Parameters174 Questions
Exam 9: Introduction to Hypothesis Testing183 Questions
Exam 10: Estimation and Hypothesis Testing for Two Population Parameters121 Questions
Exam 11: Hypothesis Tests and Estimation for Population Variances69 Questions
Exam 12: Analysis of Variance162 Questions
Exam 13: Goodness-Of-Fit Tests and Contingency Analysis105 Questions
Exam 14: Introduction to Linear Regression and Correlation Analysis139 Questions
Exam 15: Multiple Regression Analysis and Model Building148 Questions
Exam 16: Analyzing and Forecasting Time-Series Data131 Questions
Exam 17: Introduction to Nonparametric Statistics103 Questions
Exam 18: Introducing Business Analytics48 Questions
Exam 19: Introduction to Decision Analysis48 Questions
Exam 20: Introduction to Quality and Statistical Process Control42 Questions
Select questions type
In establishing a single exponential smoothing forecasting model, a starting point for the forecast value for period 1 is required. One method for arriving at this starting point is to use the first data point as the forecast for that period. If we do that, then the first data point should be ignored when computing measures of forecast error.
(True/False)
4.8/5  (37)
(37)
If a smoothing model is applied for a stable time series, a smoothing constant of 0.20 would be an appropriate value.
(True/False)
4.8/5 (33)
The Morgan Company is interested in developing a forecast for next month's sales. It has collected sales data for the past 12 months. 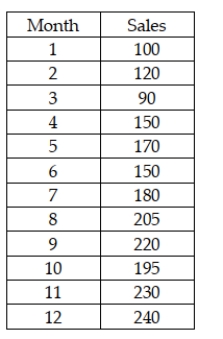 Assuming that the company plans to use double exponential smoothing with starting values for the smoothed constant process value and smoothed trend value of 98.97 and 13.16 respectively, the MAD value for periods 2-12 is greater when alpha = 0.20 and beta = 0.20 than when alpha = 0.10 and beta = 0.10.
(True/False)
4.9/5 (30)
If a manager is planning for an expansion of the factory, a forecast model with a long-term planning horizon would probably be used.
(True/False)
4.9/5 (33)
The time-series component that implies a long-term upward or downward pattern is called the trend component.
(True/False)
4.8/5 (40)
Gibson, Inc. is a holding company that owns several businesses. One such business is a truck sales company. To help in managing this operation, managers at Gibson have collected sales data for the past 20 years showing the number of trucks sold each year. They have then developed the linear trend forecasting model shown as follows: 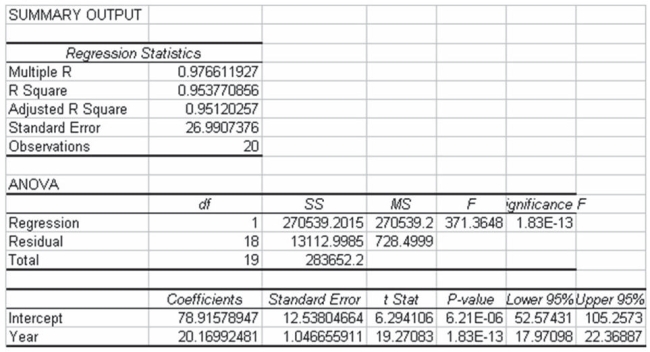 Based on this information, the fitted value for year 1 is about 99.
(True/False)
4.8/5 (35)
The reason for using split samples in developing a forecasting model is to eliminate the potential for bias in the resulting model.
(True/False)
4.8/5 (35)
If time-series data exhibit a seasonal pattern, which of the following approaches could be used to compute season indexes?
(Multiple Choice)
4.8/5 (34)
The Wilson Company is interested in forecasting demand for its XG-667 product for quarter 13 based on 12 quarters of data. The following shows the data and the double exponential smoothing model results for periods 1-12 using alpha = 0.20 and beta = 0.40. 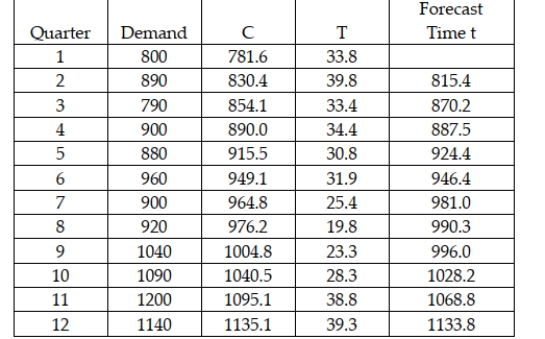 Based on this information, which of the following is the forecast for period 13?
(Multiple Choice)
4.9/5 (34)
Which of the following statements about the Durbin-Watson d statistic is true?
(Multiple Choice)
4.7/5 (39)
The All American Toy Company has a very seasonal sales pattern. Sales are high during the fall quarter, drop off substantially in the winter quarter and are more typical during spring and summer quarters. The following historical data exist for the past 16 quarters. 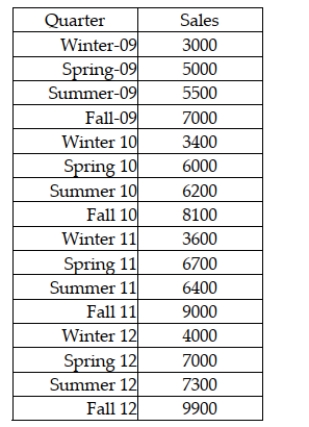 Based on these data, develop a seasonally adjusted forecast for the four quarters of 2013 using a linear trend regression model.
(Essay)
4.8/5 (37)
Filters
- Essay(0)
- Multiple Choice(0)
- Short Answer(0)
- True False(0)
- Matching(0)