Exam 16: Analyzing and Forecasting Time-Series Data
Exam 1: The Where, Why, and How of Data Collection167 Questions
Exam 2: Graphs, Charts and Tablesdescribing Your Data138 Questions
Exam 3: Describing Data Using Numerical Measures138 Questions
Exam 4: Introduction to Probability125 Questions
Exam 5: Discrete Probability Distributions161 Questions
Exam 6: Introduction to Continuous Probability Distributions122 Questions
Exam 7: Introduction to Sampling Distributions136 Questions
Exam 8: Estimating Single Population Parameters174 Questions
Exam 9: Introduction to Hypothesis Testing183 Questions
Exam 10: Estimation and Hypothesis Testing for Two Population Parameters121 Questions
Exam 11: Hypothesis Tests and Estimation for Population Variances69 Questions
Exam 12: Analysis of Variance162 Questions
Exam 13: Goodness-Of-Fit Tests and Contingency Analysis105 Questions
Exam 14: Introduction to Linear Regression and Correlation Analysis139 Questions
Exam 15: Multiple Regression Analysis and Model Building148 Questions
Exam 16: Analyzing and Forecasting Time-Series Data131 Questions
Exam 17: Introduction to Nonparametric Statistics103 Questions
Exam 18: Introducing Business Analytics48 Questions
Exam 19: Introduction to Decision Analysis48 Questions
Exam 20: Introduction to Quality and Statistical Process Control42 Questions
Select questions type
Which of the following time-series components can be identified when a company has 12 weeks of data beginning January and extending through March?
(Multiple Choice)
4.7/5  (35)
(35)
The reason for testing for the presence of autocorrelation in a regression-based trend forecasting model is that one assumption of the regression analysis is that the residuals are not correlated.
(True/False)
4.8/5 (27)
If the Durbin-Watson test leads you to reject the null hypothesis, then you are concluding that the forecast errors are positively autocorrelated.
(True/False)
4.7/5 (28)
In a recent meeting, the sales manager for a drug company stated that she needed to have a forecast prepared for each week for the next six weeks. The week in this case is the:
(Multiple Choice)
4.9/5 (33)
To compare one value measured at one point in time with other values measured at different points in time, index numbers must be used.
(True/False)
4.8/5 (40)
Recently, a manager for a major retailer computed the following seasonal indexes: 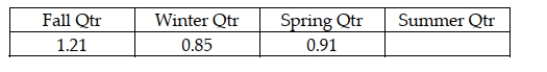 Note that the index for Summer Qtr is missing. However, it can be determined that the index for that period is approximately 1.03
(True/False)
4.9/5 (28)
A seasonally unadjusted forecast is one that is made from seasonal data without any adjustment for the seasonal component in the time series.
(True/False)
4.9/5 (37)
Assume that the year 2000 is used as the index base period and that sales were 12 million in the year 2000. If sales were 18 million in the year 2006, the simple index number for the year 2006 is:
(Multiple Choice)
5.0/5 (30)
Forecast bias measures the average amount of error per forecast, so a positive value means that forecasts tended to be too low.
(True/False)
4.8/5 (34)
One of the disadvantages of a regression-based linear trend forecasting model is that the forecast errors are computed for time periods that were used in developing the forecasting model and thus do not truly measure the forecasting ability of the model.
(True/False)
4.8/5 (36)
If a forecasting model produces forecast errors (residuals) that are negatively correlated, then we expect a negative residual to be followed by another negative residual to be followed by another negative residual and so forth.
(True/False)
4.9/5 (29)
Which of the following statistical measures is used to help decision makers assess the potential for their model to provide usable forecasts?
(Multiple Choice)
4.9/5 (32)
The Baker's Candy Company has been in business for three years. The quarterly sales data for the company are shown as follows: 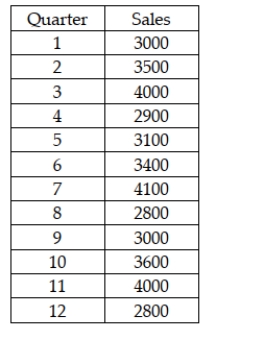 Based on these data, the seasonal index for quarters 3, 7, and 11 is approximately 1.61
(True/False)
4.9/5 (35)
Renton Industries makes replacement parts for the automobile industry. As part of the company's capacity planning, it needs a long-range total demand forecast. The following information was generated based on 10 years of historical data on total number of parts sold each year. 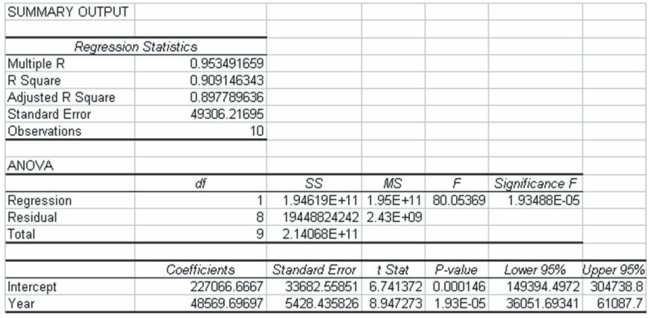 Based on this information, the percent of variation in the number of parts sold that is explained by the linear trend model is approximately 90.9.
(True/False)
4.9/5 (29)
Which of the following is true regarding the MSE and MAD in forecasting?
(Multiple Choice)
4.8/5 (35)
A company has recorded the 12 months of sales data for the past year. It wishes to use the regression approach to develop a trend-based approach for forecasting future months. The following data are provided: 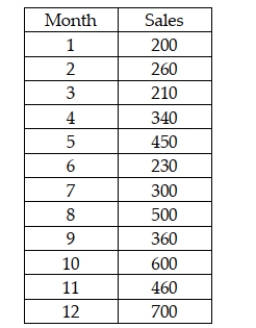 Based on this information, which of the following is forecast for month 15?
(Multiple Choice)
4.8/5 (27)
The Durbin-Watson test for autocorrelation can be reliably applied to any sample sizes.
(True/False)
4.8/5 (31)
The Boxer Company has been in business since 1998. The following sales data are recorded by quarter for the years 2010-2012. 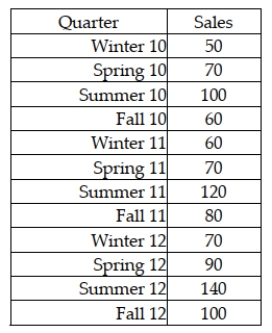 The managers at the company wish to determine the seasonal indexes for each quarter during the year. The first step in the process is to remove the seasonal and random components. To do this, they will begin by computing a four-period moving average. They then compute the centered moving average. What is the next step in applying the multiplicative model?
(Multiple Choice)
4.7/5 (35)
In analyzing a forecast model, what is the main advantage of using the MAD instead of the MSE?
(Essay)
4.8/5 (43)
Filters
- Essay(0)
- Multiple Choice(0)
- Short Answer(0)
- True False(0)
- Matching(0)