Exam 16: Analyzing and Forecasting Time-Series Data
Exam 1: The Where, Why, and How of Data Collection167 Questions
Exam 2: Graphs, Charts and Tablesdescribing Your Data138 Questions
Exam 3: Describing Data Using Numerical Measures138 Questions
Exam 4: Introduction to Probability125 Questions
Exam 5: Discrete Probability Distributions161 Questions
Exam 6: Introduction to Continuous Probability Distributions122 Questions
Exam 7: Introduction to Sampling Distributions136 Questions
Exam 8: Estimating Single Population Parameters174 Questions
Exam 9: Introduction to Hypothesis Testing183 Questions
Exam 10: Estimation and Hypothesis Testing for Two Population Parameters121 Questions
Exam 11: Hypothesis Tests and Estimation for Population Variances69 Questions
Exam 12: Analysis of Variance162 Questions
Exam 13: Goodness-Of-Fit Tests and Contingency Analysis105 Questions
Exam 14: Introduction to Linear Regression and Correlation Analysis139 Questions
Exam 15: Multiple Regression Analysis and Model Building148 Questions
Exam 16: Analyzing and Forecasting Time-Series Data131 Questions
Exam 17: Introduction to Nonparametric Statistics103 Questions
Exam 18: Introducing Business Analytics48 Questions
Exam 19: Introduction to Decision Analysis48 Questions
Exam 20: Introduction to Quality and Statistical Process Control42 Questions
Select questions type
In a double smoothing model, the second smoothing constant is introduced to account for the trend in the data if one exists.
(True/False)
4.8/5  (27)
(27)
Some stocks are referred to as cyclical stock because they tend to be in favor for several years and then out of favor for several years. This is a correct use of the term cyclical.
(True/False)
4.9/5 (29)
You are given the following linear trend model: Ft = 345.60 - 200.5(t). This model implies that in year 1, the dependent variable had a value of 145.1.
(True/False)
4.9/5 (38)
Suppose an economist has developed a model for forecasting annual consumption, yt, as function of total labor income, x1t, and total property income, x2t based on 20 years on annual data. The following regression model has been developed: t= 7.81 + 0.91x1t + 0.57x2t with the standard error = 1.29 and the Durbin-Watson d statistic = 2.09. Using an alpha = .05, which of the following is the correct critical value for testing whether the residuals are autocorrelated?
(Multiple Choice)
4.8/5 (43)
The Boxer Company has been in business since 1998. The following sales data are recorded by quarter for the years 2010-2012. 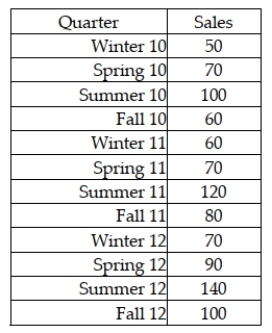 The managers at the company wish to determine the seasonal indexes for each quarter during the year. The index for the summer quarter is:
(Multiple Choice)
4.9/5 (26)
Because simple exponential smoothing models require a starting point for the first period forecast that will be arbitrary, it is important to have as much data as possible to dampen out the effect of the starting point.
(True/False)
4.8/5 (31)
The purpose of deseasonalizing a time series is that a strong seasonal pattern may make it difficult to see a trend in the time series.
(True/False)
4.9/5 (36)
The Zocor Company is interested in forecasting period 13 sales for a product. It has 12 months of historical data. The following shows the data and the forecasted values for periods 1-12 using a single exponential smoothing model with a smoothing constant value equal to 0.20. 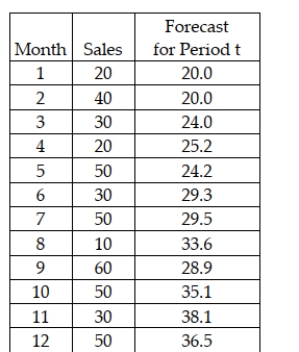 Which of the following would be the forecast for period 13?
(Multiple Choice)
4.8/5 (37)
The All American Toy Company has records for quarterly sales for the past 4 years. These data are shown as follows: 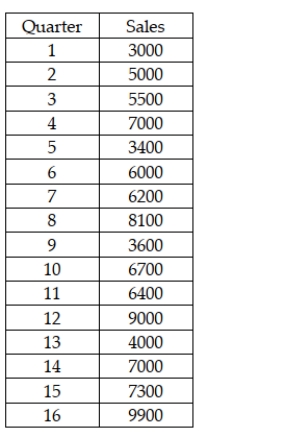 Given these data, develop a forecast for quarter 17 using a double exponential smoothing model with alpha = 0.20, beta = 0.30 and starting values for C and T based on the linear trend regression model for periods 1-16.
(Essay)
4.8/5 (26)
In a simple exponential smoothing model, which of the following statements is true?
(Multiple Choice)
4.8/5 (41)
If the historical data on which the model is being built consist of weekly data, the forecasting period would also be weekly.
(True/False)
4.9/5 (33)
In order for a time series to exhibit a seasonal component, the data must be measured in periods as short or shorter than quarterly.
(True/False)
4.8/5 (36)
A company has recorded annual sales for the past 14 years and found the following linear trend model: 
(Multiple Choice)
4.9/5 (39)
In a recent meeting, a manager indicated that sales tend to be higher during October, November, and December and lower in the spring. In making this statement, she is indicating that sales for the company are cyclical.
(True/False)
5.0/5 (31)
A company's annual sales are shown below in thousands of dollars for a period of 10 years. 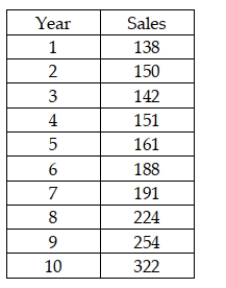 Plot the time series; find the linear regression model, and also the forecast value and error for each of the years. Also discuss whether you think a linear model appears to be appropriate.
(Essay)
4.9/5 (32)
After a linear forecasting model is found for a time series, if the Durbin-Watson statistic is less than dL this means that:
(Multiple Choice)
4.8/5 (31)
The owners of Hal's Cookie Company have collected sales data for the past 8 months. These data are shown as follows: 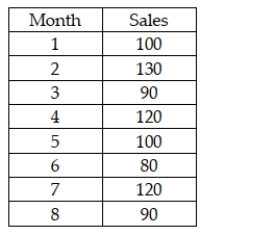 Using a smoothing constant equal to 0.20 and starting forecast in period 1 of 100, the forecast value for period 9 is approximately 104.2.
(True/False)
4.8/5 (39)
If a time-series plot indicates that the data do not appear to exhibit a trend, then a double exponential smoothing model would likely be the most appropriate to use rather than simple exponential smoothing model.
(True/False)
4.8/5 (37)
A stockbroker at a large brokerage firm recently analyzed the combined annual profits for all firms in the airline industry. One time-series component that may have been present in these annual data was a seasonal component.
(True/False)
4.8/5 (22)
Renton Industries makes replacement parts for the automobile industry. As part of the company's capacity planning, it needs a long-range total demand forecast. The following information was generated based on 10 years of historical data on total number of parts sold each year. 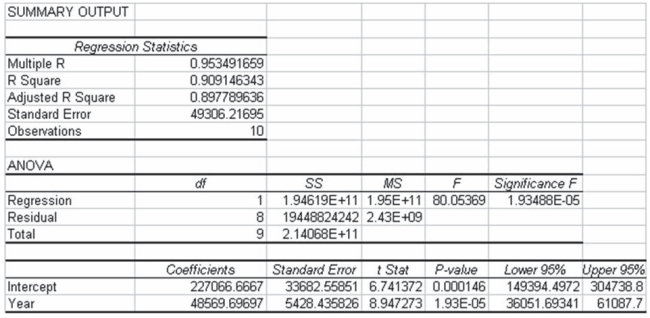 Based on this information we can conclude that the linear trend model explains a significant proportion of the variation in the number of parts sold, because the p-value is much smaller than any reasonable α that we might use.
(True/False)
4.8/5 (35)
Filters
- Essay(0)
- Multiple Choice(0)
- Short Answer(0)
- True False(0)
- Matching(0)