Exam 2: Graphical Summaries of Data
Exam 1: Basic Ideas39 Questions
Exam 2: Graphical Summaries of Data40 Questions
Exam 3: Numerical Summaries of Data76 Questions
Exam 4: Summarizing Bivariate Data33 Questions
Exam 5: Probability99 Questions
Exam 6: Discrete Probability Distributions76 Questions
Exam 7: The Normal Distribution131 Questions
Exam 8: Confidence Intervals62 Questions
Exam 9: Hypothesis Testing115 Questions
Exam 10: Two-Sample Confidence Intervals44 Questions
Exam 11: Two-Sample Hypothesis Tests43 Questions
Exam 12: Tests With Qualitative Data26 Questions
Exam 13: Inference in Linear Models51 Questions
Exam 14: Analysis of Variance48 Questions
Exam 15: Nonparametric Statistics27 Questions
Select questions type
The following frequency distribution presents the frequency of passenger vehicles that pass through a certain intersection from 8:00 AM to 9:00 AM on a particular day. Vehicle Type Frequency Motorcycle 12 Sedan 54 SUV 26 Truck 64 Construct a pie chart for the data.
(Multiple Choice)
4.8/5  (26)
(26)
The following table presents the purchase totals (in dollars) of a random sample of gasoline purchases at a convenience store.
Construct a frequency distribution using a class width of 10, and using 0 as the lower class limit for the first Class.
76.59 48.55 93.66 60.17 39.10 93.28 65.43 34.12 80.41 77.16 80.07 93.46 39.19 43.84 44.70 68.74 89.98 6.97 52.86 68.93
(Multiple Choice)
4.9/5 (32)
Helium prices: The cost of grade A Helium gas in 2003 was around $60/Mcf. Five years later it reached around $115/Mcf. Which of the following graphs accurately represents the magnitude of the Increase? Which one exaggerates it?
(Multiple Choice)
4.8/5 (42)
Thirty households were surveyed for the number of televisions in each home. Following are the results.
0 1 0 2 3 0 0 0 0 5 4 1 0 0 0 4 0 5 1 0 0 0 0 3 1 1 0 0 0 0
Construct a frequency histogram.
(Multiple Choice)
4.8/5 (29)
Construct a stem-and-leaf plot for the following data.
28 20 54 52 26 17 31 53 40 20 51 20 28 58 40 10 25 43 40 54
(Multiple Choice)
4.9/5 (32)
The following frequency distribution presents the weights in pounds (lb) of a sample of visitors to a health clinic. Clinic Visitor Weights Weight (lb) Frequency 120-129 4 130-139 13 140-149 23 150-159 42 160-169 32 170-179 24 180-189 9 190-199 3 Construct a relative frequency histogram.
(Multiple Choice)
4.8/5 (33)
The amounts 3 and 4 are compared. Which of the following graphical displays are the least misleading?
(Multiple Choice)
4.9/5 (33)
The following pie chart presents the percentages of fish caught in each of four ratings categories. Match this pie chart with its corresponding Pareto chart.
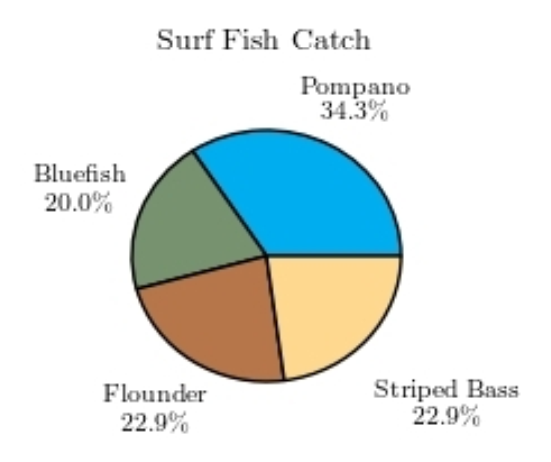
(Multiple Choice)
4.8/5 (43)
The following time-series plot presents the population growth (in percent) of a suburb of Atlanta, Georgia for each of the years 1990 through 2009. Estimate the amount by which the rate of growth
Changed from 1,995 to 2,004. 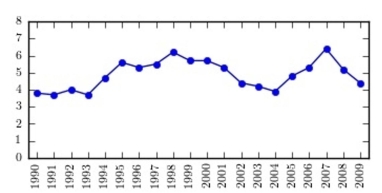
(Multiple Choice)
4.8/5 (34)
Following are the numbers of Dean's List students in a random sample of 20 university courses. Construct a dotplot for these data. 9 2 0 0 4 2 0 0 4 0 4 2 0 0 5 6 1 2 0 4
(Multiple Choice)
4.8/5 (33)
Construct a dotplot for the following data. 3.94 3.93 3.98 3.91 4.03 3.95 4.01 3.98 3.91 3.97 3.94 3.94 4.04 3.96 4.02 3.91 3.91 3.99 3.91 3.93
(Multiple Choice)
4.7/5 (35)
Chocolate or vanilla: The following bar graph shows the number of chocolate and vanilla ice cream cones sold during the annual county fair for the years 2013 - 2017. Does the graph present an accurate picture of the difference between chocolate and vanilla cones sold? Or is it misleading?
Explain. 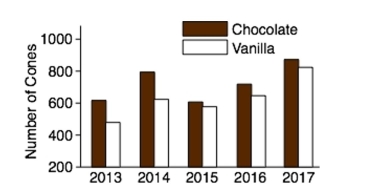
(Short Answer)
4.8/5 (41)
The following frequency distribution presents the frequency of passenger vehicles that pass through a certain intersection from 8:00 AM to 9:00 AM on a particular day. Vehicle Type Frequency Motorcycle 15 Sedan 80 SUV 88 Truck 34 What is the relative frequency of the Motorcyle category?
(Multiple Choice)
4.7/5 (38)
The following table presents the purchase totals (in dollars) of a random sample of gasoline purchases at a convenience store.
Construct a relative frequency histogram using a class width of 10, and using 0 as the lower class limit for the First class.
51.13 6.11 36.05 22.27 94.54 49.64 52.78 79.28 51.88 6.29 33.57 53.92 24.91 23.89 79.10 14.86 63.94 15.87 76.44 60.96
(Multiple Choice)
4.8/5 (32)
The following table presents the purchase totals (in dollars) of a random sample of gasoline purchases at a convenience store.
Construct a relative frequency distribution using a class width of 10, and using 0 as the lower class limit for the First class.
57.46 27.21 6.12 97.99 68.22 28.97 39.41 77.56 37.06 73.09 88.82 61.29 93.24 65.96 42.37 94.38 7.67 16.95 71.17 65.37
(Multiple Choice)
4.9/5 (35)
Following is a pie chart that presents the percentages spent by a certain household on its five largest annual expenditures. What percentage of the money spent was spent on food, housing, and utilities? 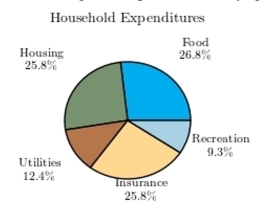
(Multiple Choice)
4.9/5 (32)
The following table presents the purchase totals (in dollars) of a random sample of gasoline purchases at a convenience store.
Construct a frequency histogram using a class width of 10, and using 0 as the lower class limit for the first Class.
69 55 17 55 81 66 99 44 34 79 22 83 91 15 35 53 74 40 55 49
(Multiple Choice)
4.8/5 (36)
One hundred students are shown an eight-digit number on a piece of cardboard for three seconds and are asked to then recite the number from memory. The process is repeated until the student accurately recites the
Entire number from memory. The following histogram presents the number of trials it took each student to
Memorize the number. 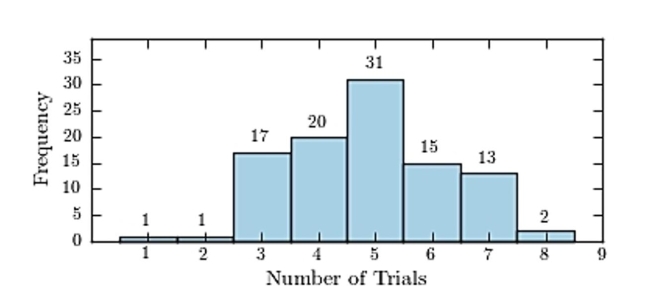 How many students memorized the number in three trials or less?
(Multiple Choice)
4.8/5 (28)
The following frequency distribution presents the frequency of passenger vehicles that pass through a certain intersection from 8:00 AM to 9:00 AM on a particular day. Vehicle Type Frequency Motorcycle 7 Sedan 63 SUV 84 Truck 30 Construct a relative frequency distribution for the data.
(Multiple Choice)
5.0/5 (29)
Filters
- Essay(0)
- Multiple Choice(0)
- Short Answer(0)
- True False(0)
- Matching(0)