Exam 6: Normal Probability Distributions
Exam 1: Introduction to Statistics155 Questions
Exam 2: Exploring Data With Tables and Graphs132 Questions
Exam 3: Describing, Exploring, and Comparing Data225 Questions
Exam 4: Probability219 Questions
Exam 5: Discrete Probability Distributions205 Questions
Exam 6: Normal Probability Distributions254 Questions
Exam 7: Estimating Parameters and Determining Sample Sizes170 Questions
Exam 8: Hypothesis Testing187 Questions
Exam 9: Inferences From Two Samples192 Questions
Exam 10: Correlation and Regression174 Questions
Exam 11: Goodness-Of-Fit and Contingency Tables100 Questions
Exam 12: Analysis of Variance113 Questions
Exam 13: Nonparametric Tests121 Questions
Exam 14: Statistical Process Control90 Questions
Select questions type
If z is a standard normal variable, find the probability.
-The probability that z lies between 0 and 3.01
(Multiple Choice)
4.9/5  (39)
(39)
Solve the problem.
-If a continuous uniform distribution has parameters of then the minimum is and the maximum is . For this distribution, find Round your answer to three decimal places.
(Multiple Choice)
4.7/5 (31)
Solve the problem.
-The probability of fewer than 43 democrats
(Multiple Choice)
4.7/5 (36)
Solve the problem. Round to the nearest tenth unless indicated otherwise.
-Scores on a test are normally distributed with a mean of 63.2 and a standard deviation of 11.7. Find P81, which separates the bottom 81% from the top 19%.
(Multiple Choice)
4.9/5 (37)
Solve the problem.
-Three randomly selected households are surveyed as a pilot project for a larger survey to be conducted later.
The numbers of people in the households are 1, 4, and 7. Consider the values of 1, 4, and 7 to be a population.
Assume that samples of size n = 2 are randomly selected with replacement from the population of 1, 4, and 7.
The nine different samples are as follows:
(1, 1), (1, 4), (1, 7), (4, 1), (4, 4), (4, 7), (7, 1), (7, 4), and (7, 7). (i) Construct a probability distribution table that
describes the sampling distribution of the proportion of even numbers when samples of size n = 2 are randomly
selected. (ii) Does the mean of the sample proportions target the value of the population proportion? (iii) Does
the sample proportion make a good estimator of the population proportion?
(Essay)
4.8/5 (27)
The normal distribution has a greater percentage of its area close to the mean and much less in the tails.
-Assume that adults have IQ scores that are normally distributed with a mean of 100 and a standard deviation of 15 (as on the Wechsler test). Find P30, which is the IQ score separating the bottom 30% from the top 70%.
(Multiple Choice)
4.7/5 (39)
Solve the problem.
-Three randomly selected households are surveyed as a pilot project for a larger survey to be conducted later.
The numbers of people in the households are 2, 3, and 8. Consider the values of 2, 3, and 8 to be a population.
Assume that samples of size n = 2 are randomly selected with replacement from the population of 2, 3, and 8.
The nine different samples are as follows:
(2, 2), (2, 3), (2, 8), (3, 2), (3, 3), (3, 8), (8, 2), (8, 3), and (8, 8). (i) Find the range of each of the nine samples, then
summarize the sampling distribution of the ranges in the format of a table representing the probability
distribution. (ii) Compare the population range to the mean of the sample ranges. (iii) Do the sample ranges
target the value of the population range? In general, do ranges make good estimators of population ranges?
Why or why not.?
(Essay)
4.8/5 (40)
Solve the problem.
-Three randomly selected households are surveyed as a pilot project for a larger survey to be conducted later.
The numbers of people in the households are 2, 4, and 10. Consider the values of 2, 4, and 10 to be a population.
Assume that samples of size n = 2 are randomly selected with replacement from the population of 2, 4, and 10.
The nine different samples are as follows: (2, 2), (2, 4), (2, 10), (4, 2), (4, 4), (4, 10), (10, 2), (10, 4), and (10, 10). (i)
Find the mean of each of the nine samples, then summarize the sampling distribution of the means in the format
of a table representing the probability distribution. (ii) Compare the population mean to the mean of the sample
means. (iii) Do the sample means target the value of the population mean? In general, do means make good
estimators of population means? Why or why not?
(Essay)
4.9/5 (38)
Solve the problem.
-A normal quartile plot is given below for the lifetimes (in hours) of a sample of batteries of a particular brand.
Use the plot to assess the normality of the lifetimes of these batteries. Explain your reasoning. 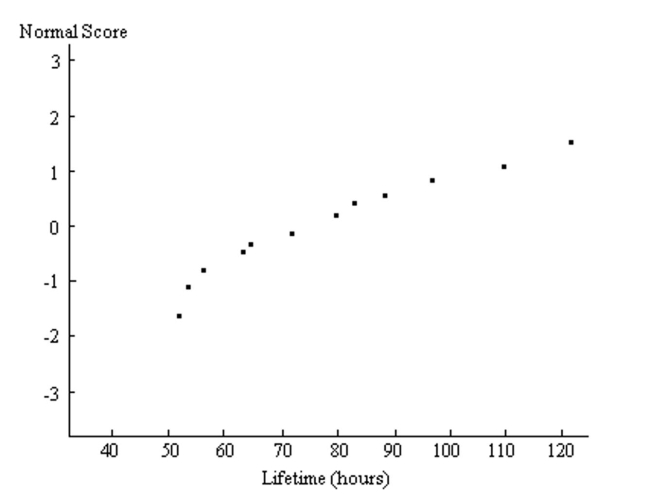
(Essay)
4.8/5 (38)
Solve the problem.
-Human body temperatures are normally distributed with a mean of 98.20°F and a standard deviation of 0.62°F. If 19 people are randomly selected, find the probability that their mean body temperature will be less than
98)50°F.
(Multiple Choice)
4.8/5 (34)
Estimate the indicated probability by using the normal distribution as an approximation to the binomial distribution.
-Two percent of hair dryers produced in a certain plant are defective. Estimate the probability that of 10,000 randomly selected hair dryers, exactly 225 are defective.
(Multiple Choice)
4.9/5 (34)
Estimate the indicated probability by using the normal distribution as an approximation to the binomial distribution.
-In one county, the conviction rate for speeding is 85%. Estimate the probability that of the next 100 speeding summonses issued, there will be at least 90 convictions.
(Multiple Choice)
4.9/5 (34)
Solve the problem.
-The ages (in years) of the four U.S. vice presidents who assumed office after presidential assassinations are
56 (A. Johnson), 51 (C. Arthur), 42 (T. Roosevelt), and 55 (L.B. Johnson). (i) Assuming that 2 of the ages are
randomly selected with replacement, list the 16 different possible samples. (ii) Find the standard deviation of
each of the 16 samples, then summarize the sampling distribution of the standard deviation in the format of a
table representing the probability distribution. (iii) Compare the population standard deviation to the mean of
the sample standard deviations. (iv) Do the sample standard deviations target the value of the population
standard deviation? In general, do sample standard deviations make good estimators of population standard
deviations? Why or why not?
(Essay)
4.9/5 (26)
Solve the problem.
-Three randomly selected households are surveyed as a pilot project for a larger survey to be conducted later.
The numbers of people in the households are 5, 6, and 9. Consider the values of 5, 6, and 9 to be a population.
Assume that samples of size n = 2 are randomly selected with replacement from the population of 5, 6, and 9.
The nine different samples are as follows: (5, 5), (5, 6), (5, 9), (6, 5), (6, 6), (6, 9), (9, 5), (9, 6), and (9, 9).
(i) Find the median of each of the nine samples, then summarize the sampling distribution of the medians in the
format of a table representing the probability distribution. (ii) Compare the population median to the mean of
the sample medians. (iii) Do the sample medians target the value of the population median? In general, do
medians make good estimators of population medians? Why or why not?
(Essay)
4.8/5 (25)
Find the indicated z score. The graph depicts the standard normal distribution with mean 0 and standard deviation 1.
-Shaded area is 0.4013. 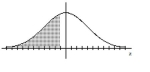
(Multiple Choice)
4.8/5 (34)
A bank's loan officer rates applicants for credit. The ratings are normally distributed with a mean of 200 and a standard deviation of 50. If an applicant is randomly selected, find the probability of a rating that is between 200
And 275.
(Multiple Choice)
4.7/5 (42)
The lengths of human pregnancies are normally distributed with a mean of 268 days and a standard deviation of 15 days. What is the probability that a pregnancy last at least 300 days?
(Multiple Choice)
4.9/5 (47)
Estimate the indicated probability by using the normal distribution as an approximation to the binomial distribution. Two percent of hair dryers produced in a certain plant are defective. Estimate the probability that
Of 10,000 randomly selected hair dryers, at least 219 are defective.
(Multiple Choice)
4.8/5 (44)
A study of the amount of time it takes a mechanic to rebuild the transmission for a 2010 Chevrolet Colorado shows that the mean is 8.4 hours and the standard deviation is 1.8 hours. If 40 mechanics are randomly selected,
Find the probability that their mean rebuild time is less than 8.9 hours.
(Multiple Choice)
4.9/5 (34)
Filters
- Essay(0)
- Multiple Choice(0)
- Short Answer(0)
- True False(0)
- Matching(0)