Exam 6: Normal Probability Distributions
Exam 1: Introduction to Statistics155 Questions
Exam 2: Exploring Data With Tables and Graphs132 Questions
Exam 3: Describing, Exploring, and Comparing Data225 Questions
Exam 4: Probability219 Questions
Exam 5: Discrete Probability Distributions205 Questions
Exam 6: Normal Probability Distributions254 Questions
Exam 7: Estimating Parameters and Determining Sample Sizes170 Questions
Exam 8: Hypothesis Testing187 Questions
Exam 9: Inferences From Two Samples192 Questions
Exam 10: Correlation and Regression174 Questions
Exam 11: Goodness-Of-Fit and Contingency Tables100 Questions
Exam 12: Analysis of Variance113 Questions
Exam 13: Nonparametric Tests121 Questions
Exam 14: Statistical Process Control90 Questions
Select questions type
Assume that X has a normal distribution, and find the indicated probability.
-The mean is .2 and the standard deviation is Find the probability that X is greater than 15.2.
(Multiple Choice)
4.7/5  (46)
(46)
Find the indicated probability.
-The diameters of bolts produced by a certain machine are normally distributed with a mean of 0.30 inches and a standard deviation of 0.01 inches. What percentage of bolts will have a diameter greater than 0.32 inches?
(Multiple Choice)
4.9/5 (38)
SAT verbal scores are normally distributed with a mean of 430 and a standard deviation of 120 (based on data
from the College Board ATP). (a) If a single student is randomly selected, find the probability that the sample
mean is above 500. (b) If a sample of 35 students are selected randomly, find the probability that the sample
mean is above 500. These two problems appear to be very similar. Which problem requires the application of
the central limit theorem, and in what way does the solution process differ between the two problems?
(Essay)
4.8/5 (38)
You will use a normal distribution to approximate a binomial distribution. Complete the following table for a
distribution in which 16. It might be helpful to make a diagram to help you determine the continuity factor
for each entry. Find the probability that The continuity correction factor is: x is at least 12 x is at most 12 x is more than 12 x is less than 12
(Essay)
4.8/5 (39)
The Precision Scientific Instrument Company manufactures thermometers that are supposed to give readings of at
the freezing point of water. Tests on a large sample of these thermometers reveal that at the freezing point of water, some
give readings below (denoted by negative numbers) and some give readings above (denoted by positive
numbers). Assume that the mean reading is and the standard deviation of the readings is Also assume that the
frequency distribution of errors closely resembles the normal distribution. A thermometer is randomly selected and
tested. Find the temperature reading corresponding to the given information.
-If 7% of the thermometers are rejected because they have readings that are too high, but all other thermometers are acceptable, find the temperature that separates the rejected thermometers from the others.
(Multiple Choice)
4.9/5 (44)
For the binomial distribution with the given values for n and p, state whether or not it is suitable to use the normal
distribution as an approximation.
-n = 20 and p = 0.9
(Multiple Choice)
5.0/5 (32)
Solve the problem.
-For women aged 18-24, systolic blood pressures (in mm Hg) are normally distributed with a mean of 114.8 and a standard deviation of 13.1. If 23 women aged 18-24 are randomly selected, find the probability that their
Mean systolic blood pressure is between 119 and 122.
(Multiple Choice)
4.8/5 (32)
The continuity correction is used to compensate for the fact that a ________ distribution is used to approximate a ________ distribution.
(Multiple Choice)
4.9/5 (37)
Solve the problem.
-The ages of 30 students selected randomly from one college are as follows: 21 23 20 24 20 19 20 19 22 32 20 24 26 21 37 23 18 34 25 30 22 24 23 19 28 20 29 21 35 25 20 21 28 22 32
(Essay)
4.7/5 (44)
Heights of adult females are normally distributed. Samples of height of adult females, each of size n = 3, are
randomly collected and the sample means are found. Is it correct to conclude that the sample means cannot be
treated as a normal distribution because the sample size is so small? Explain.
(Essay)
4.8/5 (42)
If z is a standard normal variable, find the probability.
-The probability that z is greater than -1.82
(Multiple Choice)
4.8/5 (38)
Find the indicated probability.
-Assume that the weights of quarters are normally distributed with a mean of 5.67 g and a standard deviation 0.070 g. A vending machine will only accept coins weighing between 5.48 g and 5.82 g. What percentage of legal
Quarters will be rejected?
(Multiple Choice)
4.9/5 (35)
The normal distribution has a greater percentage of its area close to the mean and much less in the tails.
-Find the indicated IQ score. The graph depicts IQ scores of adults, and those scores are normally distributed with a mean of 100 and a standard deviation of 15 (as on the Wechsler test). 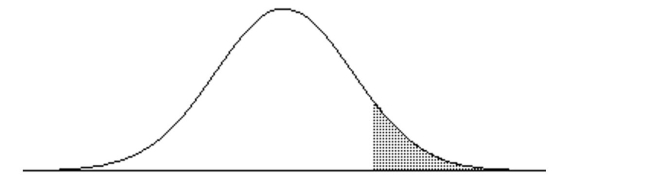 The shaded area under the curve is 0.10.
(Multiple Choice)
4.7/5 (38)
Solve the problem.
-A study of the amount of time it takes a mechanic to rebuild the transmission for a 2005 Chevrolet Cavalier shows that the mean is 8.4 hours and the standard deviation is 1.8 hours. If 40 mechanics are randomly selected,
Find the probability that their mean rebuild time is less than 8.9 hours.
(Multiple Choice)
4.9/5 (37)
Estimate the indicated probability by using the normal distribution as an approximation to the binomial distribution.
-A multiple choice test consists of 60 questions. Each question has 4 possible answers of which one is correct. If all answers are random guesses, estimate the probability of getting at least 20% correct.
(Multiple Choice)
4.7/5 (35)
Solve the problem. Round to the nearest tenth unless indicated otherwise.
-The serum cholesterol levels for men in one age group are normally distributed with a mean of 178.1 and a standard deviation of 40.4. All units are in mg/100 mL. Find the two levels that separate the top 9% and the
Bottom 9%.
(Multiple Choice)
4.7/5 (44)
Solve the problem.
-A poll of 1200 randomly selected students in grades 6 through 8 was conducted and found that 59% enjoy
playing sports. What is the sampling distribution suggested by the given data?
(Essay)
4.8/5 (38)
A normal quartile plot is given below for the weekly incomes (in dollars) of a sample of engineers in one town.
Describe what each x value represents and what each y value represents. Use the plot to assess the normality of
the incomes of engineers in this town. Explain your reasoning. 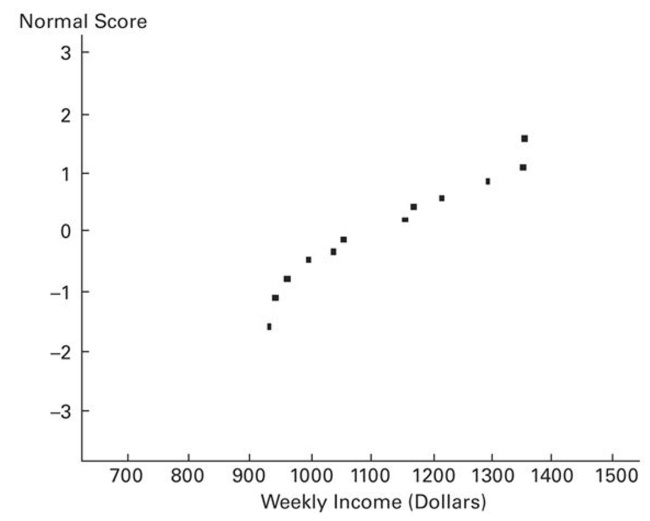
(Essay)
4.9/5 (32)
If a sample size is < ________, the sample size must come from a population having a normal distribution in order to follow normal distribution calculations.
(Multiple Choice)
4.9/5 (36)
Filters
- Essay(0)
- Multiple Choice(0)
- Short Answer(0)
- True False(0)
- Matching(0)