Exam 6: Normal Probability Distributions
Exam 1: Introduction to Statistics155 Questions
Exam 2: Exploring Data With Tables and Graphs132 Questions
Exam 3: Describing, Exploring, and Comparing Data225 Questions
Exam 4: Probability219 Questions
Exam 5: Discrete Probability Distributions205 Questions
Exam 6: Normal Probability Distributions254 Questions
Exam 7: Estimating Parameters and Determining Sample Sizes170 Questions
Exam 8: Hypothesis Testing187 Questions
Exam 9: Inferences From Two Samples192 Questions
Exam 10: Correlation and Regression174 Questions
Exam 11: Goodness-Of-Fit and Contingency Tables100 Questions
Exam 12: Analysis of Variance113 Questions
Exam 13: Nonparametric Tests121 Questions
Exam 14: Statistical Process Control90 Questions
Select questions type
If z is a standard normal variable, find the probability.
-The probability that z lies between -0.55 and 0.55
(Multiple Choice)
4.9/5  (41)
(41)
Solve the problem.
-In a certain population, 11% of people are left-handed. Suppose that you plan to randomly select 100 people and ask each person whether they are left handed. Suppose that in calculating each of the probabilities below,
You use the normal distribution as an approximation to the binomial but that you fail to use a continuity
Correction. In which cases will you obtain an answer that is too large? A: the probability that among the 100 people, at least 12 are left-handed B: the probability that among the 100 people, more than 12 are left-handed : the probability that among the 100 people, between 10 and 14 inclusive are left-handed
(Multiple Choice)
4.9/5 (32)
Solve the problem. Round to the nearest tenth unless indicated otherwise.
-A bank's loan officer rates applicants for credit. The ratings are normally distributed with a mean of 200 and a standard deviation of 50. Find P60, the score which separates the lower 60% from the top 40%.
(Multiple Choice)
4.9/5 (35)
Find the area of the shaded region. The graph depicts the standard normal distribution with mean 0 and standard
deviation 1.
-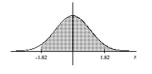
(Multiple Choice)
4.8/5 (30)
Assume that the weight loss for the first month of a diet program varies between 6 pounds and 12 pounds, and is spread evenly over the range of possibilities, so that there is a uniform distribution. Find the probability of the given range of pounds lost.
-More than 10 pounds
(Multiple Choice)
4.8/5 (36)
Solve the problem.
-The probability that the number of correct answers is between 29 and 41 inclusive
(Multiple Choice)
4.8/5 (38)
Solve the problem.
-Samples of size n = 1500 are randomly selected from the population of numbers (0 through 9) produced by a random-number generator, and the proportion of odd numbers is found for each sample. What is the
Distribution of the sample proportions?
(Multiple Choice)
4.8/5 (38)
Solve the problem.
-In one region, the September energy consumption levels for single-family homes are found to be normally distributed with a mean of 1050 kWh and a standard deviation of 218 kWh. If 50 different homes are randomly
Selected, find the probability that their mean energy consumption level for September is greater than 1075 kWh.
(Multiple Choice)
4.8/5 (38)
The heights of adult females are normally distributed. If you were to construct a histogram of 40 randomly selected women, what shape would the histogram of those heights have and what pattern would you expect in
A normal quantile plot of these data?
(Multiple Choice)
4.7/5 (34)
What is the probability that the random variable has a value greater than 1.3?
(Multiple Choice)
4.9/5 (34)
The normal distribution has a greater percentage of its area close to the mean and much less in the tails.
-Which of the following is true about the distribution of IQ scores?
(Multiple Choice)
4.9/5 (39)
Find the area of the shaded region. The graph depicts the standard normal distribution with mean 0 and standard deviation 1. 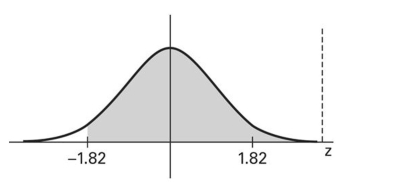
(Multiple Choice)
4.9/5 (41)
Find the probability that in 200 tosses of a fair die, we will obtain at most 30 fives. Use the normal distribution to approximate the desired probability.
(Multiple Choice)
4.8/5 (37)
Solve the problem.
-The amount of rainfall (in inches) in 25 consecutive years in a certain city. 20.4 25.1 22.8 27.0 23.5 24.2 26.0 25.6 23.3 24.1 21.9 27.6 24.7 25.3 21.6 31.0 23.6 26.1 25.5 24.8 18.1 22.4 24.9 30.0 29.3
(Essay)
4.8/5 (46)
Solve the problem.
-Assume that z scores are normally distributed with a mean of 0 and a standard deviation of 1. If find c.
(Multiple Choice)
4.7/5 (34)
The Precision Scientific Instrument Company manufactures thermometers that are supposed to give readings of at
the freezing point of water. Tests on a large sample of these thermometers reveal that at the freezing point of water, some
give readings below (denoted by negative numbers) and some give readings above (denoted by positive
numbers). Assume that the mean reading is and the standard deviation of the readings is Also assume that the
frequency distribution of errors closely resembles the normal distribution. A thermometer is randomly selected and
tested. Find the temperature reading corresponding to the given information.
-A quality control analyst wants to examine thermometers that give readings in the bottom 4%. Find the reading that separates the bottom 4% from the others.
(Multiple Choice)
4.8/5 (46)
Solve the problem.
-Tell whether the following statistic is a biased or unbiased estimator of a population parameter: Sample median used to estimate a population median.
(Multiple Choice)
4.8/5 (35)
Estimate the indicated probability by using the normal distribution as an approximation to the binomial distribution.
-The probability that a radish seed will germinate is 0.7. Estimate the probability that of 140 randomly selected seeds, exactly 100 will germinate.
(Multiple Choice)
4.9/5 (41)
A normal quartile plot is given below for a sample of scores on an aptitude test. Use the plot to assess the
normality of scores on this test. Explain your reasoning. 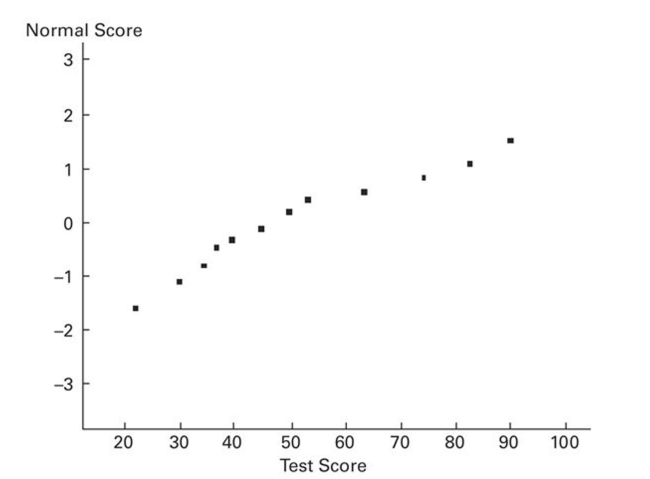
(Essay)
4.7/5 (41)
Filters
- Essay(0)
- Multiple Choice(0)
- Short Answer(0)
- True False(0)
- Matching(0)