Exam 6: Normal Probability Distributions
Exam 1: Introduction to Statistics155 Questions
Exam 2: Exploring Data With Tables and Graphs132 Questions
Exam 3: Describing, Exploring, and Comparing Data225 Questions
Exam 4: Probability219 Questions
Exam 5: Discrete Probability Distributions205 Questions
Exam 6: Normal Probability Distributions254 Questions
Exam 7: Estimating Parameters and Determining Sample Sizes170 Questions
Exam 8: Hypothesis Testing187 Questions
Exam 9: Inferences From Two Samples192 Questions
Exam 10: Correlation and Regression174 Questions
Exam 11: Goodness-Of-Fit and Contingency Tables100 Questions
Exam 12: Analysis of Variance113 Questions
Exam 13: Nonparametric Tests121 Questions
Exam 14: Statistical Process Control90 Questions
Select questions type
Assume that scores are normally distributed with a mean of 0 and a standard deviation of 1 . If , find .
(Multiple Choice)
4.8/5  (41)
(41)
Solve the problem.
-The ages (in years) of the four U.S. vice presidents who assumed office after presidential assassinations are
56 (A. Johnson), 51 (C. Arthur), 42 (T. Roosevelt), and 55 (L.B. Johnson). (i) Assuming that 2 of the ages are
randomly selected with replacement, list the 16 different possible samples. (ii) Find the median of each of the 16
samples, then summarize the sampling distribution of the medians in the format of a table representing the
probability distribution. (iii) Compare the population median to the mean of the sample medians. (iv) Do the
sample medians target the value of the population median? In general, do sample medians make good
estimators of population medians? Why or why not?
(Essay)
4.7/5 (39)
If z is a standard normal variable, find the probability.
-P(z < 0.97)
(Multiple Choice)
4.8/5 (32)
The normal distribution has a greater percentage of its area close to the mean and much less in the tails.
-Find the indicated IQ score. The graph depicts IQ scores of adults, and those scores are normally distributed with a mean of 100 and a standard deviation of 15 (as on the Wechsler test). 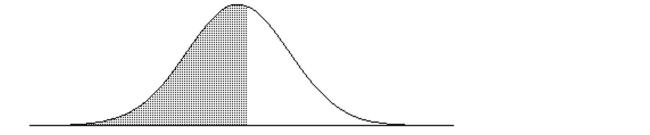 The shaded area under the curve is 0.5675.
(Multiple Choice)
4.7/5 (35)
A baseball player has a batting average of 0.346, so the probability of a hit is 0.346. Assume that his hitting attempts are independent of each other. Assume that the batter gets up to bat 4 times in each game. Estimate the
Probability that in 50 consecutive games, there are at least 45 games in which the batter gets at least one hit.
(Hint: first find the probability that in one game the batter gets at least one hit)
(Multiple Choice)
4.9/5 (44)
Three randomly selected households are surveyed as a pilot project for a larger survey to be conducted later.
The numbers of people in the households are 2, 3, and 8. Consider the values of 2, 3, and 8 to be a population.
Assume that samples of size n = 2 are randomly selected with replacement from the population of 2, 3, and 8. The nine
different samples are as follows: (2, 2), (2, 3), (2, 8), (3, 2), (3, 3), (3, 8), (8, 2), (8, 3), and (8, 8).
(i) Find the range of each of the nine samples, then summarize the sampling distribution of the ranges in the format of a
table representing the probability distribution. (ii) Compare the population range to the mean of the sample ranges.
(iii) Do the sample ranges target the value of the population range? In general, do ranges make good estimators
of population ranges? Why or why not?
(Essay)
4.8/5 (45)
Assume that X has a normal distribution, and find the indicated probability.
-The mean is .0 and the standard deviation is Find the probability that X is between 19.7 and 25.3.
(Multiple Choice)
4.8/5 (34)
For the binomial distribution with the given values for n and p, state whether or not it is suitable to use the normal
distribution as an approximation.
-n = 19 and p = 0.5
(Multiple Choice)
4.7/5 (33)
Solve the problem.
-A math teacher gives two different tests to measure students' aptitude for math. Scores on the first test are normally distributed with a mean of 22 and a standard deviation of 5. Scores on the second test are normally
Distributed with a mean of 71 and a standard deviation of 10.3. Assume that the two tests use different scales to
Measure the same aptitude. If a student scores 29 on the first test, what would be his equivalent score on the
Second test? (That is, find the score that would put him in the same percentile.)
(Multiple Choice)
4.7/5 (32)
Solve the problem.
-The ages (in years) of the four U.S. vice presidents who assumed office after presidential assassinations are
56 (A. Johnson), 51 (C. Arthur), 42 (T. Roosevelt), and 55 (L.B. Johnson). (i) Assuming that 2 of the ages are
randomly selected with replacement, list the 16 different possible samples. (ii) Find the range of each of the 16
samples, then summarize the sampling distribution of the ranges in the format of a table representing the
probability distribution. (iii) Compare the population range to the mean of the sample ranges. (iv) Do the
sample ranges target the value of the population range? In general, do sample ranges make good estimators of
population ranges? Why or why not?
(Essay)
4.8/5 (41)
What is the probability that the random variable has a value less than 6?
(Multiple Choice)
4.8/5 (37)
Assume that the weight loss for the first month of a diet program varies between 6 pounds and 12 pounds, and is spread evenly over the range of possibilities, so that there is a uniform distribution. Find the probability of the given range of pounds lost.
-Less than 11 pounds
(Multiple Choice)
4.8/5 (36)
Solve the problem.
-A normal quartile plot is given below for a sample of scores on an aptitude test. Use the plot to assess the
normality of scores on this test. Explain your reasoning. 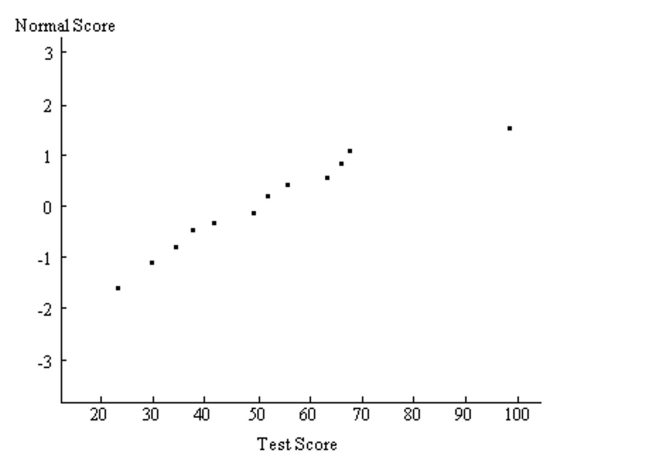
(Essay)
4.8/5 (45)
Find the area of the shaded region. The graph depicts the standard normal distribution with mean 0 and standard
deviation 1.
-
(Multiple Choice)
4.9/5 (38)
What is the probability that the random variable has a value between 5.3 and 5.7?
(Multiple Choice)
4.8/5 (36)
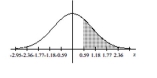
Find the indicated z score. The graph depicts the standard normal distribution with mean 0 and standard deviation 1.
-Shaded area is 0.4483. 
(Multiple Choice)
4.8/5 (32)
Solve the problem.
-Personal phone calls received in the last three days by a new employee were 2, 3, and 7. Assume that samples of
size 2 are randomly selected with replacement from this population of three values. List the different possible
samples, and find the mean of each of them.
(Essay)
4.8/5 (41)
Three randomly selected households are surveyed as a pilot project for a larger survey to be conducted later.
The numbers of people in the households are 5, 7, and 9. Consider the values of 5, 7, and 9 to be a population.
Assume that samples of size n = 2 are randomly selected with replacement from the population of 5, 7, and 9.
The nine different samples are as follows: (5, 5), (5, 7), (5, 9), (7, 5), (7, 7), (7, 9), (9, 5), (9, 7), and (9, 9). (i) Find the
mean of each of the nine samples, then summarize the sampling distribution of the means in the format of a
table representing the probability distribution. (ii) Compare the population mean to the mean of the sample
means. (iii) Do the sample means target the value of the population mean? In general, do means make good
estimators of population means? Why or why not?
(Essay)
4.9/5 (37)
Solve the problem.
-The data below represents the amount of television watched per week (in hours) for 40 randomly selected
teenagers. 13 4 17 14 9 6 7 5 14 12 20 16 0 15 10 6 5 3 13 14 15 5 3 5 8 11 12 13 14 7 4 6 9 13 3 14 24 15 17 20
(Essay)
4.9/5 (29)
Filters
- Essay(0)
- Multiple Choice(0)
- Short Answer(0)
- True False(0)
- Matching(0)