Exam 6: Normal Probability Distributions
Exam 1: Introduction to Statistics155 Questions
Exam 2: Exploring Data With Tables and Graphs132 Questions
Exam 3: Describing, Exploring, and Comparing Data225 Questions
Exam 4: Probability219 Questions
Exam 5: Discrete Probability Distributions205 Questions
Exam 6: Normal Probability Distributions254 Questions
Exam 7: Estimating Parameters and Determining Sample Sizes170 Questions
Exam 8: Hypothesis Testing187 Questions
Exam 9: Inferences From Two Samples192 Questions
Exam 10: Correlation and Regression174 Questions
Exam 11: Goodness-Of-Fit and Contingency Tables100 Questions
Exam 12: Analysis of Variance113 Questions
Exam 13: Nonparametric Tests121 Questions
Exam 14: Statistical Process Control90 Questions
Select questions type
Find the indicated probability.
-In one region, the September energy consumption levels for single-family homes are found to be normally distributed with a mean of 1050 kWh and a standard deviation of 218 kWh. For a randomly selected home, find
The probability that the September energy consumption level is between 1100 kWh and 1225 kWh.
(Multiple Choice)
4.9/5  (24)
(24)
Solve the problem. Round to the nearest tenth unless indicated otherwise.
-In one region, the September energy consumption levels for single-family homes are found to be normally distributed with a mean of 1050 kWh and a standard deviation of 218 kWh. Find P45, which is the consumption
Level separating the bottom 45% from the top 55%.
(Multiple Choice)
4.9/5 (35)
Assume that the weight loss for the first month of a diet program varies between 6 pounds and 12 pounds, and is spread evenly over the range of possibilities, so that there is a uniform distribution. Find the probability that The given range of pounds lost is between 8 pounds and 11 pounds.
(Multiple Choice)
4.8/5 (39)
A bank's loan officer rates applicants for credit. The ratings are normally distributed with a mean of 200 and a standard deviation of 50 . Find , the score which separates the lower from the top .
(Multiple Choice)
4.8/5 (34)
The probability that a radish seed will germinate is 0.7. Estimate the probability that of 140 randomly selected seeds, exactly 100 will germinate.
(Multiple Choice)
4.8/5 (36)
Identify three important criteria to determine if the use of a normal distribution is justified.
(Essay)
4.7/5 (39)
For the binomial distribution with the given values for n and p, state whether or not it is suitable to use the normal
distribution as an approximation.
-n = 62 and p = 0.7
(Multiple Choice)
4.8/5 (44)
Solve the problem.
-Three randomly selected households are surveyed as a pilot project for a larger survey to be conducted later.
The numbers of people in the households are 4, 6, and 10. Consider the values of 4, 6, and 10 to be a population.
Assume that samples of size n = 2 are randomly selected with replacement from the population of 4, 6, and 10.
The nine different samples are as follows:
(4, 4), (4, 6), (4, 10), (6, 4), (6, 6), (6, 10), (10, 4), (10, 6), and (10, 10). (i) Find the standard deviation of each of the
nine samples, then summarize the sampling distribution of the standard deviations in the format of a table
representing the probability distribution. (ii) Compare the population standard deviation to the mean of the
sample standard deviations. (iii) Do the sample standard deviations target the value of the population standard
deviation? In general, do standard deviations make good estimators of population standard deviation? Why or
why not?
(Essay)
4.9/5 (36)
State the central limit theorem. Describe the sampling distribution for a population that is uniform and for a
population that is normal.
(Essay)
4.9/5 (32)
Assume that X has a normal distribution, and find the indicated probability.
-The mean is .2 and the standard deviation is Find the probability that X is greater than 16.1.
(Multiple Choice)
4.9/5 (28)
Solve the problem.
-The amount of snowfall falling in a certain mountain range is normally distributed with a mean of 70 inches, and a standard deviation of 10 inches. What is the probability that the mean annual snowfall during 25
Randomly picked years will exceed 72.8 inches?
(Multiple Choice)
4.9/5 (38)
Solve the problem.
-In a continuous uniform distribution, µ = minimum +2 maximum and σ = ran12ge Find the mean and standard deviation for a uniform distribution having a minimum of -3 and a maximum of14.
(Multiple Choice)
4.9/5 (45)
Find the area of the shaded region. The graph depicts the standard normal distribution with mean 0 and standard
deviation 1.
-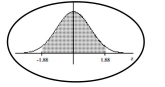
(Multiple Choice)
4.8/5 (38)
Find the area of the shaded region. The graph depicts the standard normal distribution with mean 0 and standard
deviation 1.
-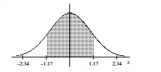
(Multiple Choice)
4.7/5 (40)
Find the area of the shaded region. The graph depicts the standard normal distribution with mean 0 and standard
deviation 1.
-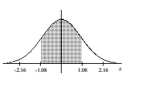
(Multiple Choice)
4.8/5 (32)
Solve the problem. Round to the nearest tenth unless indicated otherwise.
-Assume that women have heights that are normally distributed with a mean of 63.6 inches and a standard deviation of 2.5 inches. Find the value of the quartile Q3.
(Multiple Choice)
4.8/5 (30)
Estimate the indicated probability by using the normal distribution as an approximation to the binomial distribution. Estimate
(Multiple Choice)
4.9/5 (36)
Solve the problem.
-Three randomly selected households are surveyed as a pilot project for a larger survey to be conducted later.
The numbers of people in the households are 3, 6, and 10. Consider the values of 3, 6, and 10 to be a population.
Assume that samples of size n = 2 are randomly selected with replacement from the population of 3, 6, and 10.
The nine different samples are as follows:
(3, 3), (3, 6), (3, 10), (6, 3), (6, 6), (6, 10), (10, 3), (10, 6), and (10, 10). (i) Find the variance of each of the nine
samples, then summarize the sampling distribution of the variances in the format of a table representing the
probability distribution. (ii) Compare the population variance to the mean of the sample variances. (iii) Do the
sample variances target the value of the population variance? In general, do variances make good estimators of
population variances? Why or why not?
(Essay)
4.8/5 (39)
Define the central limit theorem and its relationship to the sampling distribution of sample means. Define how
you can approximate a normal distribution from an original population that is not normally distributed
(Essay)
4.9/5 (36)
continuity correction diminishes.
-A baseball player has a batting average of 0.346, so the probability of a hit is 0.346. Assume that his hitting attempts are independent of each other. Assume that the batter gets up to bat 4 times in each game. Estimate the
Probability that in 50 consecutive games, there are at least 45 games in which the batter gets at least one hit.
(Hint: first find the probability that in one game the batter gets at least one hit)
(Multiple Choice)
4.7/5 (37)
Filters
- Essay(0)
- Multiple Choice(0)
- Short Answer(0)
- True False(0)
- Matching(0)