Exam 6: Normal Probability Distributions
Exam 1: Introduction to Statistics155 Questions
Exam 2: Exploring Data With Tables and Graphs132 Questions
Exam 3: Describing, Exploring, and Comparing Data225 Questions
Exam 4: Probability219 Questions
Exam 5: Discrete Probability Distributions205 Questions
Exam 6: Normal Probability Distributions254 Questions
Exam 7: Estimating Parameters and Determining Sample Sizes170 Questions
Exam 8: Hypothesis Testing187 Questions
Exam 9: Inferences From Two Samples192 Questions
Exam 10: Correlation and Regression174 Questions
Exam 11: Goodness-Of-Fit and Contingency Tables100 Questions
Exam 12: Analysis of Variance113 Questions
Exam 13: Nonparametric Tests121 Questions
Exam 14: Statistical Process Control90 Questions
Select questions type
Estimate the indicated probability by using the normal distribution as an approximation to the binomial distribution.
-Estimate the probability of getting exactly 43 boys in 90 births.
(Multiple Choice)
4.7/5  (36)
(36)
Solve the problem.
-The numbers obtained on 50 rolls of a die. 1 5 5 3 6 4 5 6 3 4 2 5 3 5 4 2 1 4 3 1 6 1 2 6 1 2 5 3 3 4 4 1 3 1 6 2 2 5 5 3 3 5 1 6 2 1 1 4 6 5
(Essay)
4.8/5 (37)
Solve the problem.
-A history teacher assigns letter grades on a test according to the following scheme:
A: Top 10\%
B: Scores below the top and above the bottom
C: Scores below the top 40\% and above the bottom 20\%
D: Scores below the top and above the bottom
F: Bottom Scores on the test are normally distributed with a mean of 70 and a standard deviation of 12.9. Find the numerical limits for each letter grade.
(Multiple Choice)
4.8/5 (25)
Estimate the probability of getting exactly 43 boys in 90 births. Estimate the indicated probability by using the normal distribution as an approximation to the binomial distribution.
(Multiple Choice)
4.9/5 (40)
The Precision Scientific Instrument Company manufactures thermometers that are supposed to give readings of at
the freezing point of water. Tests on a large sample of these thermometers reveal that at the freezing point of water, some
give readings below (denoted by negative numbers) and some give readings above (denoted by positive
numbers). Assume that the mean reading is and the standard deviation of the readings is Also assume that the
frequency distribution of errors closely resembles the normal distribution. A thermometer is randomly selected and
tested. Find the temperature reading corresponding to the given information.
-Find Q , the third quartile.
(Multiple Choice)
4.8/5 (27)
Find the indicated probability.
-The volumes of soda in quart soda bottles are normally distributed with a mean of 32.3 oz and a standard deviation of 1.2 oz. What is the probability that the volume of soda in a randomly selected bottle will be less
Than 32 oz?
(Multiple Choice)
4.8/5 (38)
The Precision Scientific Instrument Company manufactures thermometers that are supposed to give readings of at
the freezing point of water. Tests on a large sample of these thermometers reveal that at the freezing point of water, some
give readings below (denoted by negative numbers) and some give readings above (denoted by positive
numbers). Assume that the mean reading is and the standard deviation of the readings is Also assume that the
frequency distribution of errors closely resembles the normal distribution. A thermometer is randomly selected and
tested. Find the temperature reading corresponding to the given information.
-Find P , the 40th percentile.
(Multiple Choice)
4.8/5 (38)
Solve the problem.
-A study of the amount of time it takes a mechanic to rebuild the transmission for a 2005 Chevrolet Cavalier shows that the mean is 8.4 hours and the standard deviation is 1.8 hours. If 40 mechanics are randomly selected,
Find the probability that their mean rebuild time exceeds 9.1 hours.
(Multiple Choice)
4.9/5 (33)
The Precision Scientific Instrument Company manufactures thermometers that are supposed to give readings of at
the freezing point of water. Tests on a large sample of these thermometers reveal that at the freezing point of water, some
give readings below (denoted by negative numbers) and some give readings above (denoted by positive
numbers). Assume that the mean reading is and the standard deviation of the readings is Also assume that the
frequency distribution of errors closely resembles the normal distribution. A thermometer is randomly selected and
tested. Find the temperature reading corresponding to the given information.
-If 7% of the thermometers are rejected because they have readings that are too low, but all other thermometers are acceptable, find the temperature that separates the rejected thermometers from the others.
(Multiple Choice)
4.9/5 (36)
Assume that the red blood cell counts of women are normally distributed with a mean of 4.577 million cells per microliter and a standard deviation of 0.382 million cells per microliter. Find the value closest to the probability
That a randomly selected woman has a red blood cell count above the normal range of 4.2 to 5.4 million cells per
Microliter.
(Multiple Choice)
4.8/5 (36)
Find the indicated z score. The graph depicts the standard normal distribution with mean 0 and standard deviation 1.
-Shaded area is 0.0901. 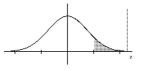
(Multiple Choice)
4.9/5 (38)
Assume that X has a normal distribution, and find the indicated probability.
-The mean is and the standard deviation is Find the probability that X is between 134.4 and 140.1.
(Multiple Choice)
4.8/5 (46)
The Precision Scientific Instrument Company manufactures thermometers that are supposed to give readings of at
the freezing point of water. Tests on a large sample of these thermometers reveal that at the freezing point of water, some
give readings below (denoted by negative numbers) and some give readings above (denoted by positive
numbers). Assume that the mean reading is and the standard deviation of the readings is Also assume that the
frequency distribution of errors closely resembles the normal distribution. A thermometer is randomly selected and
tested. Find the temperature reading corresponding to the given information.
-If 9% of the thermometers are rejected because they have readings that are too high, but all other thermometers are acceptable, find the temperature that separates the rejected thermometers from the others.
(Multiple Choice)
4.8/5 (35)
Find the indicated z score. The graph depicts the standard normal distribution with mean 0 and standard deviation 1.
-Shaded area is 0.8599. 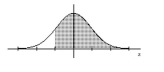
(Multiple Choice)
4.8/5 (34)
For the binomial distribution with the given values for n and p, state whether or not it is suitable to use the normal
distribution as an approximation.
-n = 17 and p = 0.8
(Multiple Choice)
4.7/5 (31)
Solve the problem.
-A recent survey based on a random sample of n = 450 voters, predicted that the Independent candidate for the
mayoral election will get 24% of the vote, but he actually gets 28%. Can it be concluded that the survey was
done incorrectly?
(Essay)
4.9/5 (32)
Solve the problem.
-After constructing a new manufacturing machine, 5 prototype integrated circuit chips are produced and it is
found that 1 is defective (D) and 4 are acceptable (A). Assume that two of the chips are randomly selected with
replacement from this population. (i) After identifying the 25 different possible samples, find the proportion of
circuits that are acceptable in each of them, then use a table to describe the sampling distribution of the
proportions of circuits that are acceptable. (ii) Find the mean of the sampling distribution. (iii) Is the mean of the
sampling distribution equal to the population proportion of circuits that are acceptable? (iv) Does the mean of
the sampling distribution of proportions always equal the population proportion?
(Essay)
4.8/5 (41)
Solve the problem.
-The ages (in years) of the four U.S. vice presidents who assumed office after presidential assassinations are
56 (A. Johnson), 51 (C. Arthur), 42 (T. Roosevelt), and 55 (L.B. Johnson). (i) Assuming that 2 of the ages are
randomly selected with replacement, list the 16 different possible samples. (ii) Find the variance of each of the
16 samples, then summarize the sampling distribution of the variances in the format of a table representing the
probability distribution. (iii) Compare the population variance to the mean of the sample variances. (iv) Do the
sample variances target the value of the population variance? In general, do sample variances make good
estimators of population variances? Why or why not?
(Essay)
4.9/5 (38)
What is the probability that the random variable has a value less than 2.7?
(Multiple Choice)
4.8/5 (30)
Solve the problem.
-A poll of 2000 randomly selected students in grades 6 through 8 was conducted and found that 41% enjoy
playing sports. Would confidence in the results increase if the sample size were 3800 instead of 2000? Why or
why not?
(Essay)
4.8/5 (45)
Filters
- Essay(0)
- Multiple Choice(0)
- Short Answer(0)
- True False(0)
- Matching(0)