Exam 6: Normal Probability Distributions
Exam 1: Introduction to Statistics155 Questions
Exam 2: Exploring Data With Tables and Graphs132 Questions
Exam 3: Describing, Exploring, and Comparing Data225 Questions
Exam 4: Probability219 Questions
Exam 5: Discrete Probability Distributions205 Questions
Exam 6: Normal Probability Distributions254 Questions
Exam 7: Estimating Parameters and Determining Sample Sizes170 Questions
Exam 8: Hypothesis Testing187 Questions
Exam 9: Inferences From Two Samples192 Questions
Exam 10: Correlation and Regression174 Questions
Exam 11: Goodness-Of-Fit and Contingency Tables100 Questions
Exam 12: Analysis of Variance113 Questions
Exam 13: Nonparametric Tests121 Questions
Exam 14: Statistical Process Control90 Questions
Select questions type
If z is a standard normal variable, find the probability.
-The probability that z is less than 1.13
(Multiple Choice)
4.8/5  (43)
(43)
Find the area of the shaded region. The graph depicts the standard normal distribution with mean 0 and standard
deviation 1.
-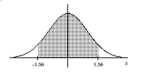
(Multiple Choice)
4.9/5 (37)
Solve the problem.
-A poll of 1200 randomly selected students in grades 6 through 8 was conducted and found that 34% enjoy
playing sports. Is the 34% result a statistic or a parameter? Explain.
(Essay)
4.8/5 (29)
Solve the problem.
-For women aged 18-24, systolic blood pressures (in mm Hg) are normally distributed with a mean of 114.8 and a standard deviation of 13.1. If 36 women are selected at random from a population of 300 women aged 18-24,
Find the probability that their mean systolic blood pressure will be less than 110 mm Hg. Assume that the
Sampling is done without replacement and use a finite population correction factor with N = 300.
(Multiple Choice)
4.9/5 (27)
Find the area of the shaded region. The graph depicts the standard normal distribution with mean 0 and standard deviation 1. 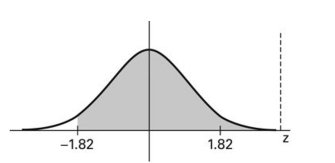
(Multiple Choice)
4.9/5 (40)
If z is a standard normal variable, find the probability.
-The probability that z lies between 0.7 and 1.98
(Multiple Choice)
4.8/5 (32)
Estimate the indicated probability by using the normal distribution as an approximation to the binomial distribution.
-With n = 20 and p = 0.60, estimate P(fewer than 8).
(Multiple Choice)
4.8/5 (34)
If a histogram of a sample of men's ages is skewed, what do you expect to see in the normal quantile plot?
(Multiple Choice)
4.9/5 (38)
Solve the problem.
-Three randomly selected households are surveyed as a pilot project for a larger survey to be conducted later.
The numbers of people in the households are 1, 4, and 8. Consider the values of 1, 4, and 8 to be a population.
Assume that samples of size n = 2 are randomly selected with replacement from the population of 1, 4, and 8.
The nine different samples are as follows: (1, 1), (1, 4), (1, 8), (4, 1), (4, 4), (4, 8), (8, 1), (8, 4), and (8, 8). (i) Find
the standard deviation of each of the nine samples, then summarize the sampling distribution of the standard
deviations in the format of a table representing the probability distribution. (ii) Compare the population
standard deviation to the mean of the sample standard deviations. (iii) Do the sample standard deviations
target the value of the population standard deviation? In general, do standard deviations make good estimators
of population standard deviation? Why or why not?
(Essay)
4.8/5 (38)
Solve the problem. Round to the nearest tenth unless indicated otherwise.
-Scores on an English test are normally distributed with a mean of 37.3 and a standard deviation of 8. Find the score that separates the top 59% from the bottom 41%
(Multiple Choice)
4.9/5 (35)
Solve the problem.
-In a population of 225 women, the heights of the women are normally distributed with a mean of 64.5 inches and a standard deviation of 2.9 inches. If 25 women are selected at random, find the probability that their mean
Height will exceed 66 inches. Assume that the sampling is done without replacement and use a finite population
Correction factor with N = 225.
(Multiple Choice)
4.8/5 (37)
In one region, the September energy consumption levels for single -family homes are found to be normally distributed with a mean of 1050 kWh and a standard deviation of 218 kWh. For a randomly selected home, find
The probability that the September energy consumption level is between 1100 kWh and 1225 kWh.
(Multiple Choice)
4.8/5 (34)
The normal distribution has a greater percentage of its area close to the mean and much less in the tails.
-Find the area of the shaded region. The graph depicts IQ scores of adults, and those scores are normally distributed with a mean of 100 and a standard deviation of 15 (as on the Wechsler test). 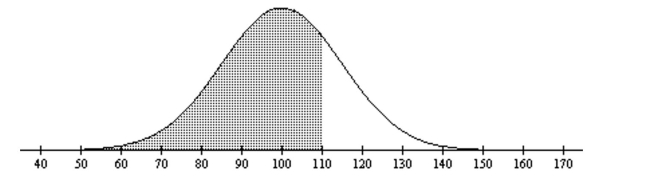
(Multiple Choice)
4.9/5 (45)
The number of books sold over the course of the four-day book fair were 194, 197, 247, and 76. Assume that
samples of size 2 are randomly selected with replacement from this population of four values. List the different
possible samples, and find the mean of each of them.
(Essay)
4.8/5 (38)
Solve the problem.
-Scores on a test have a mean of 67 and is 83. The scores have a distribution that is approximately normal. Find the standard deviation. Round your answer to the nearest tenth.
(Multiple Choice)
4.8/5 (37)
Solve the problem.
-Three randomly selected households are surveyed as a pilot project for a larger survey to be conducted later.
The numbers of people in the households are 2, 4, and 8. Consider the values of 2, 4, and 8 to be a population.
Assume that samples of size n = 2 are randomly selected with replacement from the population of 2, 4, and 8.
The nine different samples are as follows: (2, 2), (2, 4), (2, 8), (4, 2), (4, 4), (4, 8), (8, 2), (8, 4), and (8, 8). (i) Find
the variance of each of the nine samples, then summarize the sampling distribution of the variances in the
format of a table representing the probability distribution. (ii) Compare the population variance to the mean of
the sample variances. (iii) Do the sample variances target the value of the population variance? In general, do
variances make good estimators of population variances? Why or why not?
(Essay)
4.8/5 (29)
Solve the problem.
-The annual precipitation amounts in a certain mountain range are normally distributed with a mean of 109 inches, and a standard deviation of 10 inches. What is the probability that the mean annual precipitation during
25 randomly picked years will be less than 111.8 inches?
(Multiple Choice)
4.9/5 (39)
The Precision Scientific Instrument Company manufactures thermometers that are supposed to give readings of 0°C at the freezing point of water. Tests on a large sample of these thermometers reveal that at the freezing
Point of water, some give readings below 0°C (denoted by negative numbers) and some give readings above
0°C (denoted by positive numbers). Assume that the mean reading is 0°C and the standard deviation of the
Readings is 1.00°C. Also assume that the frequency distribution of errors closely resembles the normal
Distribution. A thermometer is randomly selected and tested. A quality control analyst wants to examine
Thermometers that give readings in the bottom 4%. Find the temperature reading that separates the bottom 4%
From the others.
(Multiple Choice)
4.9/5 (35)
A normal quartile plot is given below for the lifetimes (in hours) of a sample of batteries of a particular brand.
Use the plot to assess the normality of the lifetimes of these batteries. Explain your reasoning. 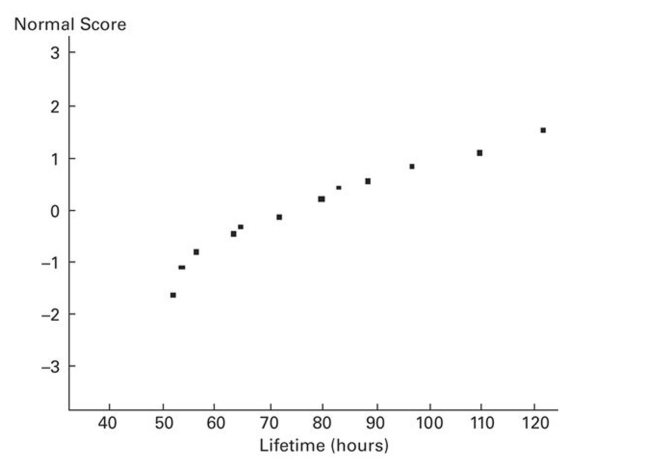
(Essay)
4.8/5 (44)
Solve the problem.
-The probability of more than 44 correct answers
(Multiple Choice)
4.8/5 (37)
Filters
- Essay(0)
- Multiple Choice(0)
- Short Answer(0)
- True False(0)
- Matching(0)