Exam 6: Normal Probability Distributions
Exam 1: Introduction to Statistics155 Questions
Exam 2: Exploring Data With Tables and Graphs132 Questions
Exam 3: Describing, Exploring, and Comparing Data225 Questions
Exam 4: Probability219 Questions
Exam 5: Discrete Probability Distributions205 Questions
Exam 6: Normal Probability Distributions254 Questions
Exam 7: Estimating Parameters and Determining Sample Sizes170 Questions
Exam 8: Hypothesis Testing187 Questions
Exam 9: Inferences From Two Samples192 Questions
Exam 10: Correlation and Regression174 Questions
Exam 11: Goodness-Of-Fit and Contingency Tables100 Questions
Exam 12: Analysis of Variance113 Questions
Exam 13: Nonparametric Tests121 Questions
Exam 14: Statistical Process Control90 Questions
Select questions type
Solve the problem.
-The probability of no more than 35 defective CD's
(Multiple Choice)
4.9/5  (46)
(46)
Assume that the weight loss for the first month of a diet program varies between 6 pounds and 12 pounds, and is spread evenly over the range of possibilities, so that there is a uniform distribution. Find the probability of the given range of pounds lost.
-Between 8.5 pounds and 10 pounds
(Multiple Choice)
4.9/5 (27)
Explain how a nonstandard normal distribution differs from the standard normal distribution. Describe the
process for finding probabilities for nonstandard normal distributions.
(Essay)
4.7/5 (33)
Estimate the indicated probability by using the normal distribution as an approximation to the binomial distribution.
-A product is manufactured in batches of 120 and the overall rate of defects is 5%. Estimate the probability that a randomly selected batch contains more than 6 defects.
(Multiple Choice)
5.0/5 (35)
Find the indicated z score. The graph depicts the standard normal distribution with mean 0 and standard deviation 1.
-Shaded area is 0.0401. 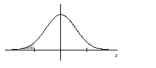
(Multiple Choice)
4.7/5 (42)
The normal distribution has a greater percentage of its area close to the mean and much less in the tails.
-Which of the following is true about the distribution of IQ scores?
(Multiple Choice)
4.9/5 (41)
Find the indicated probability.
-A bank's loan officer rates applicants for credit. The ratings are normally distributed with a mean of 200 and a standard deviation of 50. If an applicant is randomly selected, find the probability of a rating that is between 200
And 275.
(Multiple Choice)
4.7/5 (30)
After constructing a new manufacturing machine, five prototype integrated circuit chips are produced and it is
found that two are defective and three are acceptable. Assume that two of the chips are randomly selected with
replacement from this population. After identifying the 25 possible samples, find the proportion of defects in
each of them, using a table to describe the sampling distribution of the proportions of the defects.
(Essay)
4.9/5 (31)
Find the indicated probability.
-The lengths of human pregnancies are normally distributed with a mean of 268 days and a standard deviation of 15 days. What is the probability that a pregnancy lasts at least 300 days?
(Multiple Choice)
4.8/5 (46)
Solve the problem.
-In a population of 210 women, the heights of the women are normally distributed with a mean of 64.4 inches and a standard deviation of 2.9 inches. If 36 women are selected at random, find the mean and standard
Deviation of the population of sample means. Assume that the sampling is done without replacement and
Use a finite population correction factor.
(Multiple Choice)
4.9/5 (45)
Find the indicated z score. The graph depicts the standard normal distribution with mean 0 and standard deviation 1.
-Shaded area is 0.0901. 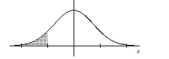
(Multiple Choice)
4.8/5 (33)
Use the normal distribution to approximate the desired probability.
-Merta reports that 74% of its trains are on time. A check of 60 randomly selected trains shows that 38 of them arrived on time. Find the probability that among the 60 trains, 38 or fewer arrive on time. Based on the result,
Does it seem plausible that the "on-time" rate of 74% could be correct?
(Multiple Choice)
4.9/5 (29)
Solve the problem.
-A normal quartile plot is given below for a sample of scores on an aptitude test. Use the plot to assess the
normality of scores on this test. Explain your reasoning. 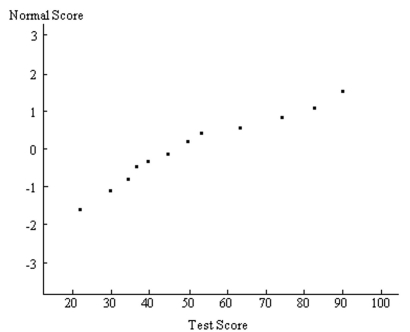
(Essay)
4.9/5 (39)
Filters
- Essay(0)
- Multiple Choice(0)
- Short Answer(0)
- True False(0)
- Matching(0)