Exam 1: Functions and Graphs
Exam 1: Functions and Graphs362 Questions
Exam 2: Polynomial, Power, and Rational Functions494 Questions
Exam 3: Exponential, Logistic, and Logarithmic Functions350 Questions
Exam 4: Trigonometric Functions522 Questions
Exam 5: Analytic Trigonometry313 Questions
Exam 6: Applications of Trigonometry333 Questions
Exam 7: Systems and Matrices354 Questions
Exam 8: Analytic Geometry in Two and Three Dimensions167 Questions
Exam 9: Discrete Mathematics154 Questions
Exam 10: Statistics and Probability147 Questions
Exam 11: An Introduction to Calculus: Limits, Derivatives, and Integrals167 Questions
Exam 12: Prerequisites382 Questions
Select questions type
Identify which of the twelve basic functions listed below fit the description given.
-The three functions that are bounded above
(Multiple Choice)
5.0/5  (36)
(36)
Fill in the blanks to complete the statement.
-The graph of can be obtained from the graph of by shifting horizontally ? units to the and shifting vertically ? units to the ? direction.
(Multiple Choice)
4.7/5 (36)
Solve the problem.
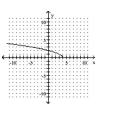
-Use the graph of to estimate the local maximum and local minimum.
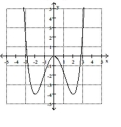
(Multiple Choice)
4.8/5 (38)
Choose the one alternative that best completes the statement or answers the question.
Graph the piecewise-defined function.
-
(Multiple Choice)
4.9/5 (32)
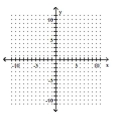
Find the asymptote(s) of the given function.
- horizontal asymptotes(s)
(Multiple Choice)
4.9/5 (40)
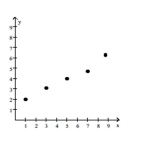
Tell which of the following types of regression is likely to give the most accurate model for the scatter plot shown: linear
regression, quadratic regression, cubic regression, exponential regression, sinusoidal regression.
-
(Multiple Choice)
4.8/5 (35)
Choose the one alternative that best completes the statement or answers the question.
Graph the piecewise-defined function.
-
(Multiple Choice)
4.9/5 (28)
Sketch the graph of y1 as a solid line or curve. Then sketch the graph of y2 as a dashed line or curve by one or more of
these: a vertical and/or horizontal shift of the graph y1, a vertical stretch or shrink of the graph of y1, or a reflection of the
graph of y1 across an axis.
-
(Multiple Choice)
4.8/5 (41)
Solve the problem.
-Some of the results of an analysis, on the makeup of garbage, are given in the following table. The table displays various years which gives the number of pounds per person per day of various types of waste materials.
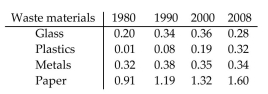 For paper, calculate the average rates of change between consecutive data points in the table. Interpret the meani your results.
(Multiple Choice)
4.9/5 (21)
Describe how to transform the graph of f into the graph of g.
-
(Multiple Choice)
4.8/5 (33)
Determine algebraically whether the function is even, odd, or neither even nor odd.
-
(Multiple Choice)
4.8/5 (35)
Choose the one alternative that best completes the statement or answers the question.
Solve the problem.
-
(Multiple Choice)
4.9/5 (30)
Write the word or phrase that best completes each statement or answers the question.
Graph the function on your calculator in order to answer the following questions:
On what intervals is the function increasing? decreasing?
Is the function odd, even, or neither?
Give the function's extrema, if any.
Find the horizontal asymptotes, if any.
How does the graph relate to a graph of one of the twelve basic functions?
-
(Essay)
4.8/5 (22)
Perform the requested operation or operations. Find the domain of each.
- and
Find .
(Multiple Choice)
4.8/5 (43)
Filters
- Essay(0)
- Multiple Choice(0)
- Short Answer(0)
- True False(0)
- Matching(0)