Exam 1: Functions and Graphs
Exam 1: Functions and Graphs362 Questions
Exam 2: Polynomial, Power, and Rational Functions494 Questions
Exam 3: Exponential, Logistic, and Logarithmic Functions350 Questions
Exam 4: Trigonometric Functions522 Questions
Exam 5: Analytic Trigonometry313 Questions
Exam 6: Applications of Trigonometry333 Questions
Exam 7: Systems and Matrices354 Questions
Exam 8: Analytic Geometry in Two and Three Dimensions167 Questions
Exam 9: Discrete Mathematics154 Questions
Exam 10: Statistics and Probability147 Questions
Exam 11: An Introduction to Calculus: Limits, Derivatives, and Integrals167 Questions
Exam 12: Prerequisites382 Questions
Select questions type
Identify intervals on which the function is increasing, decreasing, or constant.
-
(Multiple Choice)
4.8/5  (34)
(34)
Identify which of the twelve basic functions listed below fit the description given.
-The four functions with local minima
(Multiple Choice)
4.8/5 (27)
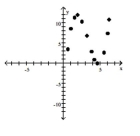
Tell which of the following types of regression is likely to give the most accurate model for the scatter plot shown: linear
regression, quadratic regression, cubic regression, exponential regression, sinusoidal regression.
-
(Multiple Choice)
4.8/5 (37)
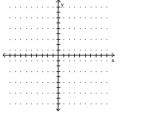
Sketch the graph of y1 as a solid line or curve. Then sketch the graph of y2 as a dashed line or curve by one or more of
these: a vertical and/or horizontal shift of the graph y1, a vertical stretch or shrink of the graph of y1, or a reflection of the
graph of y1 across an axis.
-
(Multiple Choice)
4.9/5 (31)
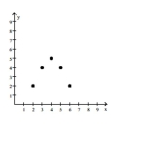
Tell which of the following types of regression is likely to give the most accurate model for the scatter plot shown: linear
regression, quadratic regression, cubic regression, exponential regression, sinusoidal regression.
-
(Multiple Choice)
4.8/5 (43)
Solve the problem.
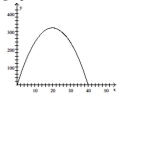
-A rock is thrown vertically upward from the surface of the moon at a velocity of . The graph shows the height of the rock, in meters, after seconds. Estimate and interpret the turning point (the point at which the graph reaches its maximum value).
(Multiple Choice)
4.8/5 (31)
Give the equation of the function g whose graph is described.
-The graph of is horizontally shrunk by a factor of .
(Multiple Choice)
4.9/5 (33)
Identify intervals on which the function is increasing, decreasing, or constant.
-
(Multiple Choice)
5.0/5 (32)
Solve the equation graphically by converting it to an equivalent equation with 0 on the right-hand side and then finding
the x-intercepts.
-
(Multiple Choice)
4.8/5 (30)
Find two functions defined implicitly by the given relation.
-
(Multiple Choice)
4.9/5 (30)
Write the word or phrase that best completes each statement or answers the question.
Sketch the graph of the given function based on the graph of the function f given below.
-
(Essay)
4.9/5 (29)
Choose the one alternative that best completes the statement or answers the question.
Write a mathematical expression for the quantity described verbally.
-A salary after a increase, if the original salary is x dollars
(Multiple Choice)
4.7/5 (25)
Filters
- Essay(0)
- Multiple Choice(0)
- Short Answer(0)
- True False(0)
- Matching(0)