Exam 1: Functions and Graphs
Exam 1: Functions and Graphs362 Questions
Exam 2: Polynomial, Power, and Rational Functions494 Questions
Exam 3: Exponential, Logistic, and Logarithmic Functions350 Questions
Exam 4: Trigonometric Functions522 Questions
Exam 5: Analytic Trigonometry313 Questions
Exam 6: Applications of Trigonometry333 Questions
Exam 7: Systems and Matrices354 Questions
Exam 8: Analytic Geometry in Two and Three Dimensions167 Questions
Exam 9: Discrete Mathematics154 Questions
Exam 10: Statistics and Probability147 Questions
Exam 11: An Introduction to Calculus: Limits, Derivatives, and Integrals167 Questions
Exam 12: Prerequisites382 Questions
Select questions type
Solve the problem.
-Estimate graphically the local maximum and local minimum of .
(Multiple Choice)
4.8/5  (35)
(35)
Match the numerical model to the corresponding model.
- x 0 3 8 15 24 35 y 1 2 3 4 5 6
(Multiple Choice)
4.8/5 (33)
Fill in the blanks to complete the statement.
-The graph of can be obtained from the graph of by vertically stretching by a factor of ? reflecting across the -axis, and shifting vertically units in the direction.
(Multiple Choice)
4.9/5 (39)
Describe how to transform the graph of f into the graph of g.
- and
(Multiple Choice)
4.9/5 (38)
Determine whether the formula determines y as a function of x.
-
(True/False)
4.8/5 (40)
Solve the problem.
-The following information pertains to a bakery which makes donuts.
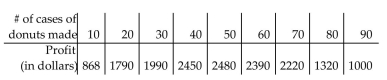 Make a scatterplot of the data. Then graph the following two functions on the same coordinate system: . Decide which function best models the data, and then use that function to estimate the maximum possible profit.
(Multiple Choice)
4.8/5 (35)
Describe how to transform the graph of f into the graph of g.
- and
(Multiple Choice)
4.8/5 (36)
Identify which of the twelve basic functions listed below fit the description given.
-The two functions that have end behavior
(Multiple Choice)
4.8/5 (39)
Perform the requested operation or operations. Find the domain of each.
-
Find .
(Multiple Choice)
4.9/5 (30)
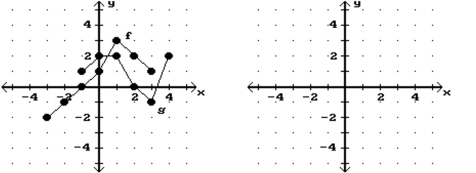
Consider the functions f and g as shown in the graph. Sketch the graph of the indicated sum or difference of functions.
-Graph f .
(Multiple Choice)
4.9/5 (31)
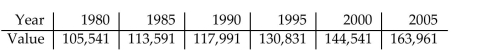
Solve the problem.
-The following data set gives the average home value, in dollars, for a city at 5 -year intervals.
 Determine where is increasing or decreasing.
(Multiple Choice)
4.7/5 (41)
Write the specified quantity as a function of the specified variable.
-A square is inscribed in a circle. Write the area of the square as a function of the radius.
(Multiple Choice)
4.9/5 (31)
Find the (x,y) pair for the value of the parameter.
- and for
(Multiple Choice)
4.8/5 (34)
Perform the requested operation or operations. Find the domain of each.
-
Find .
(Multiple Choice)
4.8/5 (28)
Choose the one alternative that best completes the statement or answers the question.
Solve the problem.
-Let compute the cost of a rental car after days of use at per day. What does compute?
(Multiple Choice)
4.9/5 (39)
Filters
- Essay(0)
- Multiple Choice(0)
- Short Answer(0)
- True False(0)
- Matching(0)