Exam 18: A Roadmap for Analyzing Data
Exam 1: Defining and Collecting Data207 Questions
Exam 2: Organizing and Visualizing Variables213 Questions
Exam 3: Numerical Descriptive Measures167 Questions
Exam 4: Basic Probability171 Questions
Exam 5: Discrete Probability Distributions217 Questions
Exam 6: The Normal Distributions and Other Continuous Distributions189 Questions
Exam 7: Sampling Distributions135 Questions
Exam 8: Confidence Interval Estimation189 Questions
Exam 9: Fundamentals of Hypothesis Testing: One-Sample Tests187 Questions
Exam 10: Two-Sample Tests208 Questions
Exam 11: Analysis of Variance216 Questions
Exam 12: Chi-Square and Nonparametric Tests178 Questions
Exam 13: Simple Linear Regression214 Questions
Exam 14: Introduction to Multiple Regression336 Questions
Exam 15: Multiple Regression Model Building99 Questions
Exam 16: Time-Series Forecasting173 Questions
Exam 17: Business Analytics115 Questions
Exam 18: A Roadmap for Analyzing Data329 Questions
Exam 19: Statistical Applications in Quality Management Online162 Questions
Exam 20: Decision Making Online129 Questions
Exam 21: Understanding Statistics: Descriptive and Inferential Techniques39 Questions
Select questions type
If a 95% confidence interval for a multiple regression parameter includes 0, there is insufficient evidence to conclude the coefficient contributes significantly to the model.
(True/False)
4.9/5  (36)
(36)
An airline wants to select a computer software package for its reservation system.Four software packages (1, 2, 3, and 4)are commercially available.An experiment is set up in which each package is used to make reservations for 5 randomly selected weeks and data on the number of passengers that are bumped over a month are collected.A total of 20 weeks was included in the experiment.The variability of the number of passengers that are bumped is found to be roughly the same for the 4 packages.The distribution on the number of passengers that are bumped has been found out to be right-skewed for package 1 and 4, left-skewed for package 2 and normal for package 3.Which of the following tests will be the most appropriate to find out if the mean number of passengers being bumped over a month is the same across the 4 packages?
(Multiple Choice)
4.9/5 (34)
SCENARIO 18-8 The superintendent of a school district wanted to predict the percentage of students passing a sixth-grade proficiency test.She obtained the data on percentage of students passing the proficiency test (% Passing), daily mean of the percentage of students attending class (% Attendance), mean teacher salary in dollars (Salaries), and instructional spending per pupil in dollars (Spending)of 47 schools in the state. Following is the multiple regression output with  as the dependent variable,
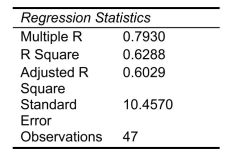
 -Referring to Scenario 18-8, you can conclude that instructional spending per pupil individually has no impact on the mean percentage of students passing the proficiency test, considering the effect of all the other independent variables, at a 1% level of significance based solely on the 95% confidence interval estimate for 3 .
(True/False)
4.9/5 (33)
SCENARIO 18-6 A weight-loss clinic wants to use regression analysis to build a model for weight-loss of a client (measured in pounds).Two variables thought to affect weight-loss are client's length of time on the weight loss program and time of session.These variables are described below: Y = Weight-loss (in pounds)  = Length of time in weight-loss program (in months)
  = 1 if morning session, 0 if not
  = 1 if afternoon session, 0 if not (Base level = evening session) Data for 12 clients on a weight-loss program at the clinic were collected and used to fit the interaction model:
  Partial output from Microsoft Excel follows:
 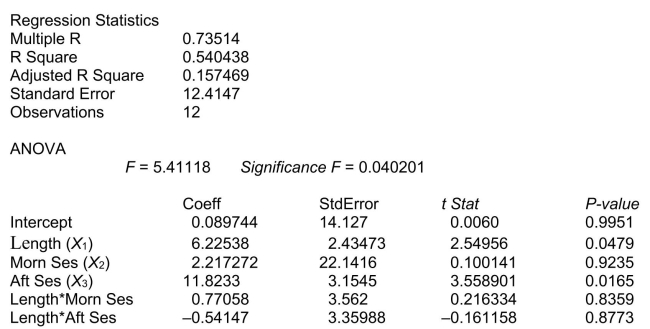 -Referring to Scenario 18-6, in terms of the
  in the model, give the mean change in weight-loss (Y)for every 1 month increase in time in the program (
  when attending the evening session.
(Multiple Choice)
4.9/5 (25)
SCENARIO 18-9 What are the factors that determine the acceleration time (in sec.)from 0 to 60 miles per hour of a car? Data on the following variables for 171 different vehicle models were collected: Accel Time: Acceleration time in sec. Cargo Vol: Cargo volume in cu.ft. HP: Horsepower MPG: Miles per gallon SUV: 1 if the vehicle model is an SUV with Coupe as the base when SUV and Sedan are both 0 Sedan: 1 if the vehicle model is a sedan with Coupe as the base when SUV and Sedan are both 0 The regression results using acceleration time as the dependent variable and the remaining variables as the independent variables are presented below. SCENARIO 18-9 cont. 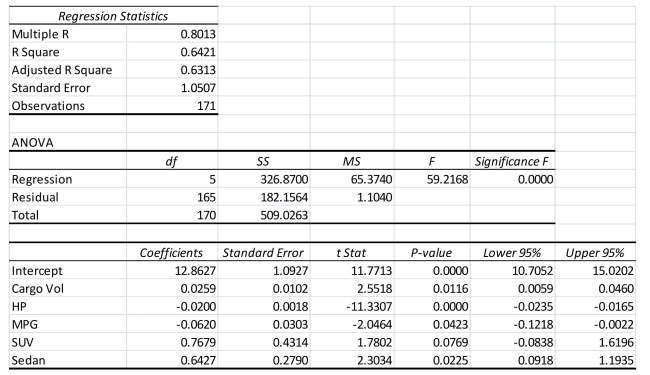 The various residual plots are as shown below.
 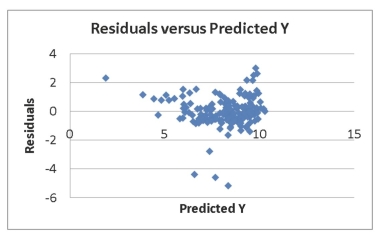 SCENARIO 18-9 cont.
 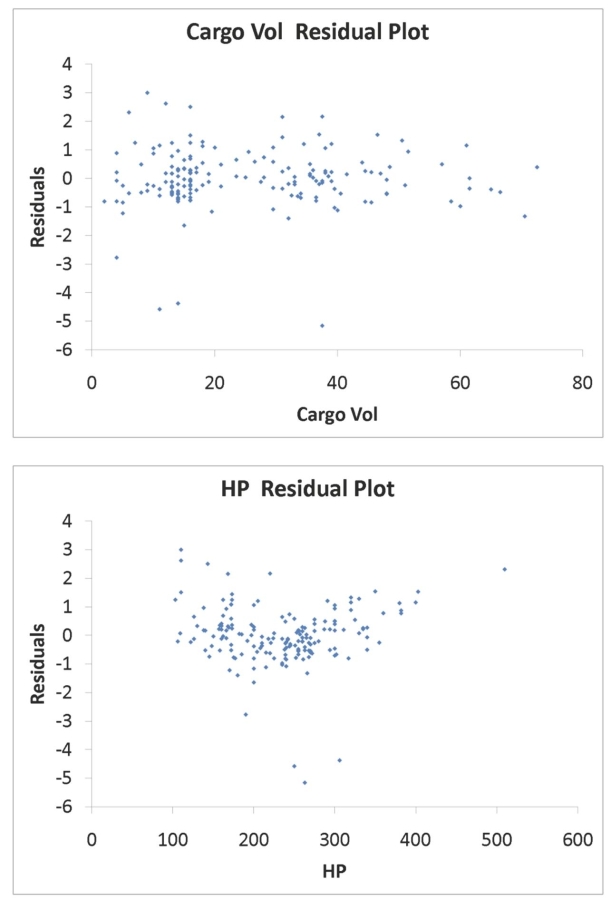 SCENARIO 18-9 cont.
 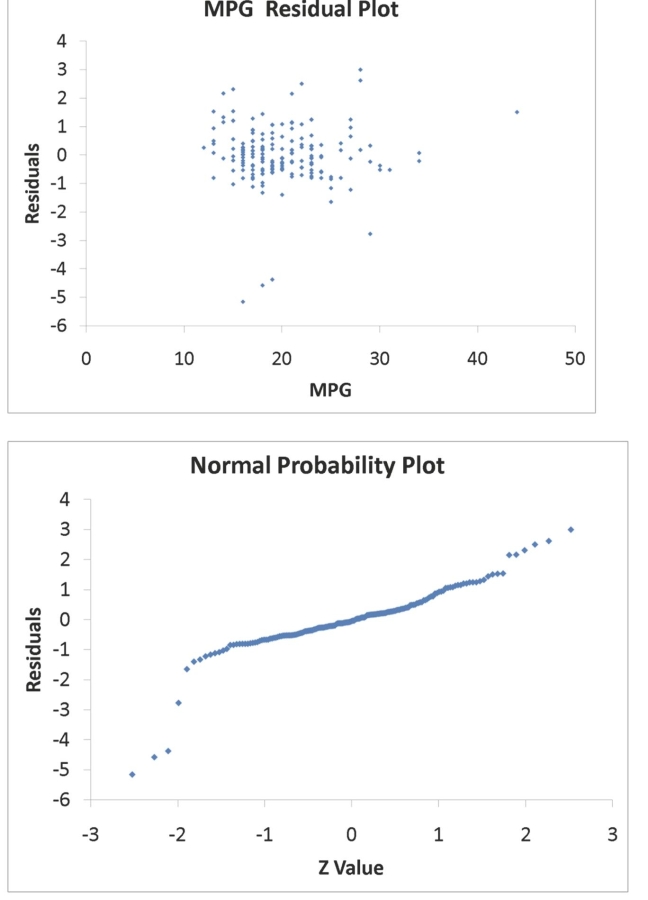 The coefficient of partial determination
 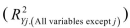 of each of the 5 predictors are, respectively, 0.0380, 0.4376, 0.0248, 0.0188, and 0.0312. The coefficient of multiple determination for the regression model using each of the 5 variables
  as the dependent variable and all other X variables as independent variables (
  )are, respectively, 0.7461, 0.5676, 0.6764, 0.8582, 0.6632.
-Referring to Scenario 18-9, the 0 to 60 miles per hour acceleration time of a sedan is predicted to be 0.1252 seconds higher than that of an SUV.
)are, respectively, 0.7461, 0.5676, 0.6764, 0.8582, 0.6632.
-Referring to Scenario 18-9, the 0 to 60 miles per hour acceleration time of a sedan is predicted to be 0.1252 seconds higher than that of an SUV.
(True/False)
4.8/5 (45)
SCENARIO 18-10 Given below are results from the regression analysis where the dependent variable is the number of weeks a worker is unemployed due to a layoff (Unemploy)and the independent variables are the age of the worker (Age), the number of years of education received (Edu), the number of years at the previous job (Job Yr), a dummy variable for marital status (Married: 1 = married, 0 = otherwise), a dummy variable for head of household (Head: 1 = yes, 0 = no)and a dummy variable for management position (Manager: 1 = yes, 0 = no).We shall call this Model 1.The coefficient of partial determination 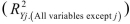 of each of the 6 predictors are, respectively, 0.2807, 0.0386, 0.0317, 0.0141, 0.0958, and 0.1201.
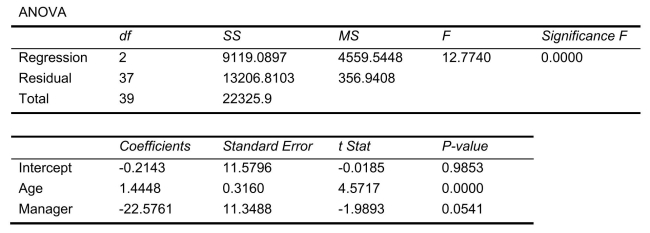
 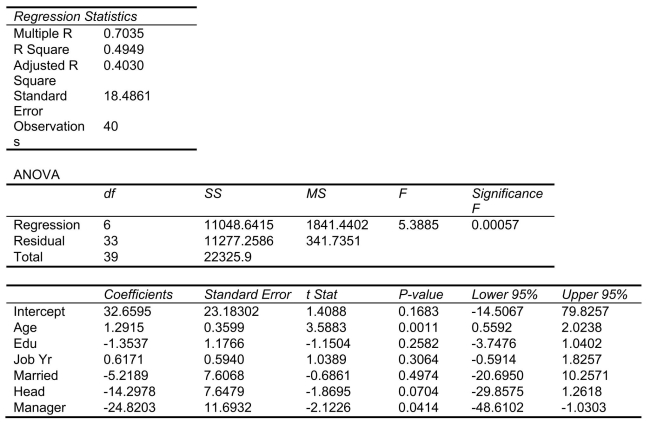 Model 2 is the regression analysis where the dependent variable is Unemploy and the independent variables are Age and Manager.The results of the regression analysis are given below:
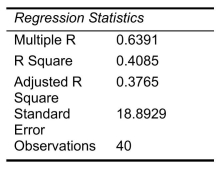
 -Referring to Scenario 18-10 Model 1, estimate the mean number of weeks being unemployed due to a layoff for a worker who is a thirty-year old, has 10 years of education, has 15 years of experience at the previous job, is married, is the head of household and is a manager.
(Short Answer)
4.9/5 (38)
A realtor wants to compare the variability of sales-to-appraisal ratios of residential properties sold in four neighborhoods (A, B, C, and D).Four properties are randomly selected from each neighborhood and the ratios recorded for each were collected.Which of the following tests will be the most appropriate?
(Multiple Choice)
4.9/5 (28)
SCENARIO 18-1 A real estate builder wishes to determine how house size (House)is influenced by family income (Income), family size (Size), and education of the head of household (School).House size is measured in hundreds of square feet, income is measured in thousands of dollars, and education is in years.The builder randomly selected 50 families and ran the multiple regression.Microsoft Excel output is provided below: SUMMARY OUTPUT 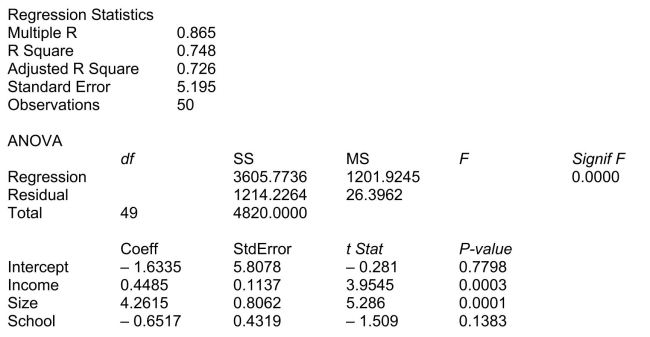 -Referring to Scenario 18-1, at the 0.01 level of significance, what conclusion should the builder draw regarding the inclusion of School in the regression model?
(Multiple Choice)
4.8/5 (31)
SCENARIO 18-8 The superintendent of a school district wanted to predict the percentage of students passing a sixth-grade proficiency test.She obtained the data on percentage of students passing the proficiency test (% Passing), daily mean of the percentage of students attending class (% Attendance), mean teacher salary in dollars (Salaries), and instructional spending per pupil in dollars (Spending)of 47 schools in the state. Following is the multiple regression output with as the dependent variable,
-Referring to Scenario 18-8, what are the lower and upper limits of the 95% confidence interval estimate for the effect of a one dollar increase in instructional spending per pupil on the mean percentage of students passing the proficiency test?
(Short Answer)
4.8/5 (32)
A certain type of new business succeeds 60% of the time.Suppose that 3 such businesses open (where they do not compete with each other, so it is reasonable to believe that their relative successes would be independent).Which of the following distributions would you use to determine the probability that all of them will fail?
(Multiple Choice)
4.9/5 (34)
A sample of 100 fuses from a very large shipment is found to have 10 that are defective. Based on this information, which of the following will you construct to learn about the proportion of fuses that are defective?
(Multiple Choice)
4.7/5 (36)
SCENARIO 18-8 The superintendent of a school district wanted to predict the percentage of students passing a sixth-grade proficiency test.She obtained the data on percentage of students passing the proficiency test (% Passing), daily mean of the percentage of students attending class (% Attendance), mean teacher salary in dollars (Salaries), and instructional spending per pupil in dollars (Spending)of 47 schools in the state. Following is the multiple regression output with as the dependent variable,
-Referring to Scenario 18-8, which of the following is the correct null hypothesis to test whether daily mean of the percentage of students attending class has any effect on percentage of students passing the proficiency test, considering the effect of all the other independent variables?
(Multiple Choice)
4.8/5 (40)
SCENARIO 18-9 What are the factors that determine the acceleration time (in sec.)from 0 to 60 miles per hour of a car? Data on the following variables for 171 different vehicle models were collected: Accel Time: Acceleration time in sec. Cargo Vol: Cargo volume in cu.ft. HP: Horsepower MPG: Miles per gallon SUV: 1 if the vehicle model is an SUV with Coupe as the base when SUV and Sedan are both 0 Sedan: 1 if the vehicle model is a sedan with Coupe as the base when SUV and Sedan are both 0 The regression results using acceleration time as the dependent variable and the remaining variables as the independent variables are presented below. SCENARIO 18-9 cont. The various residual plots are as shown below. SCENARIO 18-9 cont. SCENARIO 18-9 cont. The coefficient of partial determination of each of the 5 predictors are, respectively, 0.0380, 0.4376, 0.0248, 0.0188, and 0.0312. The coefficient of multiple determination for the regression model using each of the 5 variables as the dependent variable and all other X variables as independent variables ( )are, respectively, 0.7461, 0.5676, 0.6764, 0.8582, 0.6632.
-Referring to Scenario 18-9, the 0 to 60 miles per hour acceleration time of a coupe is predicted to be 0.7679 seconds lower than that of an SUV.
(True/False)
4.9/5 (33)
SCENARIO 18-11 A logistic regression model was estimated in order to predict the probability that a randomly chosen university or college would be a private university using information on mean total Scholastic Aptitude Test score (SAT)at the university or college, the room and board expense measured in thousands of dollars (Room/Brd), and whether the TOEFL criterion is at least 550 (Toefl550 = 1 if yes, 0 otherwise.)The dependent variable, Y, is school type (Type = 1 if private and 0 otherwise). The Minitab output is given below: 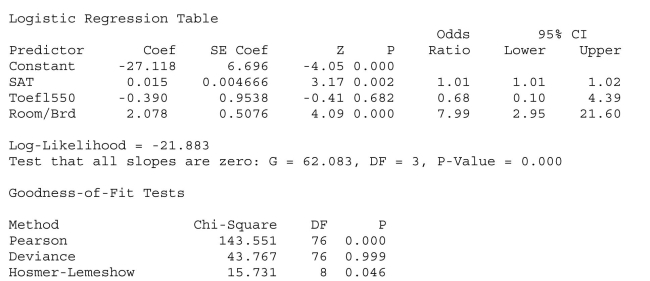 -Referring to Scenario 18-11, there is not enough evidence to conclude that the model is not a good-fitting model at a 0.05 level of significance.
(True/False)
4.9/5 (40)
SCENARIO 18-8 The superintendent of a school district wanted to predict the percentage of students passing a sixth-grade proficiency test.She obtained the data on percentage of students passing the proficiency test (% Passing), daily mean of the percentage of students attending class (% Attendance), mean teacher salary in dollars (Salaries), and instructional spending per pupil in dollars (Spending)of 47 schools in the state. Following is the multiple regression output with as the dependent variable,
-Referring to Scenario 18-8, you can conclude that instructional spending per pupil has no impact on the mean percentage of students passing the proficiency test, considering the effect of all the other independent variables, at a 5% level of significance using the 95% confidence interval estimate for 
(True/False)
4.9/5 (34)
SCENARIO 18-9 What are the factors that determine the acceleration time (in sec.)from 0 to 60 miles per hour of a car? Data on the following variables for 171 different vehicle models were collected: Accel Time: Acceleration time in sec. Cargo Vol: Cargo volume in cu.ft. HP: Horsepower MPG: Miles per gallon SUV: 1 if the vehicle model is an SUV with Coupe as the base when SUV and Sedan are both 0 Sedan: 1 if the vehicle model is a sedan with Coupe as the base when SUV and Sedan are both 0 The regression results using acceleration time as the dependent variable and the remaining variables as the independent variables are presented below. SCENARIO 18-9 cont. The various residual plots are as shown below. SCENARIO 18-9 cont. SCENARIO 18-9 cont. The coefficient of partial determination of each of the 5 predictors are, respectively, 0.0380, 0.4376, 0.0248, 0.0188, and 0.0312. The coefficient of multiple determination for the regression model using each of the 5 variables as the dependent variable and all other X variables as independent variables ( )are, respectively, 0.7461, 0.5676, 0.6764, 0.8582, 0.6632.
-Referring to Scenario 18-9, what is the p-value of the test statistic to determine whether
(Short Answer)
4.8/5 (42)
Every spring semester, the School of Business coordinates with local business leaders a luncheon for graduating seniors, their families, and friends.Corporate sponsorship pays for the lunches of each of the seniors, but students have to purchase tickets to cover the cost of lunches served to guests they bring with them.Data on the number of guests each graduating senior invited to the luncheon from 500 graduating seniors last year were collected.Based on this information, which of the following will you construct to learn about the percentage of seniors who will bring at least one guest to a luncheon?
(Multiple Choice)
4.8/5 (39)
SCENARIO 18-8 The superintendent of a school district wanted to predict the percentage of students passing a sixth-grade proficiency test.She obtained the data on percentage of students passing the proficiency test (% Passing), daily mean of the percentage of students attending class (% Attendance), mean teacher salary in dollars (Salaries), and instructional spending per pupil in dollars (Spending)of 47 schools in the state. Following is the multiple regression output with as the dependent variable,
-Referring to Scenario 18-8, the null hypothesis 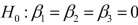 implies that percentage of students passing the proficiency test is not affected by any of the explanatory variables.
(True/False)
4.8/5 (34)
SCENARIO 18-8 The superintendent of a school district wanted to predict the percentage of students passing a sixth-grade proficiency test.She obtained the data on percentage of students passing the proficiency test (% Passing), daily mean of the percentage of students attending class (% Attendance), mean teacher salary in dollars (Salaries), and instructional spending per pupil in dollars (Spending)of 47 schools in the state. Following is the multiple regression output with as the dependent variable,
-Referring to Scenario 18-8, you can conclude that mean teacher salary has no impact on the mean percentage of students passing the proficiency test at a 5% level of significance using the 95% confidence interval estimate for 
(True/False)
4.9/5 (36)
A sample of 200 students at a Big-Ten university was taken after the midterm to ask whether they went bar hopping the weekend before the midterm or spent the weekend studying, and whether they did well or poorly on the midterm.You can use a contingency table to present this information.
(True/False)
4.7/5 (42)
Filters
- Essay(0)
- Multiple Choice(0)
- Short Answer(0)
- True False(0)
- Matching(0)