Exam 18: Review of Statistical Inference
Exam 1: What Is Statistics41 Questions
Exam 2: Graphical and Tabular Descriptive Techniques199 Questions
Exam 3: Numerical Descriptive Techniques226 Questions
Exam 4: Data Collection and Sampling82 Questions
Exam 5: Probability212 Questions
Exam 6: Random Variables and Discrete Probability Distributions174 Questions
Exam 7: Continuous Probability Distributions167 Questions
Exam 8: Sampling Distributions133 Questions
Exam 9: Introduction to Estimation88 Questions
Exam 10: Introduction to Hypothesis Testing186 Questions
Exam 11: Inference About a Population76 Questions
Exam 12: Inference About Comparing Two Populat85 Questions
Exam 13: Inference About Comparing Two Populat85 Questions
Exam 14: Analysis of Variance127 Questions
Exam 15: Chi-Squared Tests118 Questions
Exam 16: Simple Linear Regression and Correlat238 Questions
Exam 17: Multiple Regression147 Questions
Exam 18: Review of Statistical Inference189 Questions
Select questions type
A chi-squared goodness-of-fit test is always conducted as a(n):
(Multiple Choice)
4.8/5  (38)
(38)
Consider the following ANOVA table: 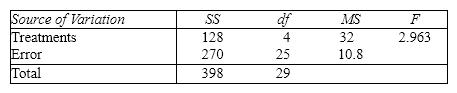 The total number of observations is:
(Multiple Choice)
4.9/5 (40)
The degrees of freedom for the test statistic in a test of a contingency table is ( r - 1 )( c - 1 )where r is the number of rows in the table, and c is the number of columns.
(True/False)
4.8/5 (34)
If the sampled population is nonnormal, the t -test of the population mean m is still valid, provided that the condition is not extreme.
(True/False)
4.8/5 (30)
The expected value of the difference of two sample means equals the difference of the corresponding population means when:
(Multiple Choice)
4.9/5 (42)
A random sample of 25 observations is selected from a normally distributed population. The sample variance is 10. In the 95% confidence interval for the population variance, the upper limit is:
(Multiple Choice)
4.8/5 (35)
The ANOVA procedure tests to determine whether differences exist between two or more population ____________________.
(Short Answer)
4.9/5 (35)
In regression analysis, you predict the value of one variable on the basis of one or more other related variables. The variable being predicted is called the ____________________ variable, and the related variables used to make the prediction are called ____________________ variables.
(Short Answer)
4.8/5 (35)
The regression line  has been fitted to the data points (4, 8), (2, 5), and (1, 2). The sum of the squared residuals will be:
(Multiple Choice)
4.7/5 (45)
In conducting a chi-squared goodness-of-fit test, an essential condition is that all expected frequencies are at least five.
(True/False)
4.9/5 (41)
The pooled-variances t -test requires that the two population variances need not be the same.
(True/False)
4.8/5 (38)
The test statistic employed to test  is
is  is F -distributed with v 1 = n 1 - 1 and v 2 = n 2 - 1 degrees of freedom if the two populations are F -distributed.
(True/False)
4.7/5 (34)
The test for the equality of two population variances is based on the:
(Multiple Choice)
4.9/5 (38)
During a natural gas shortage, a gas company randomly sampled residential gas meters in order to monitor daily gas consumption. On a particular day, a sample of 100 meters showed a sample mean of 250 cubic feet and a sample standard deviation of 50 cubic feet. Provide a 90% confidence interval estimate of the mean gas consumption for the population.
(Essay)
4.9/5 (34)
Which of the following statements regarding multicollinearity is not true?
(Multiple Choice)
4.8/5 (41)
In testing the significance of a multiple regression model with three independent variables, the null hypothesis is 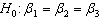 .
.
(True/False)
4.8/5 (36)
A regression analysis between sales (in $)and advertising (in $)resulted in the following least squares line:  . This implies that an increase of $1 in advertising is associated with an increase of $60 in sales.
(True/False)
4.9/5 (36)
Filters
- Essay(0)
- Multiple Choice(0)
- Short Answer(0)
- True False(0)
- Matching(0)