Exam 18: Review of Statistical Inference
Exam 1: What Is Statistics41 Questions
Exam 2: Graphical and Tabular Descriptive Techniques199 Questions
Exam 3: Numerical Descriptive Techniques226 Questions
Exam 4: Data Collection and Sampling82 Questions
Exam 5: Probability212 Questions
Exam 6: Random Variables and Discrete Probability Distributions174 Questions
Exam 7: Continuous Probability Distributions167 Questions
Exam 8: Sampling Distributions133 Questions
Exam 9: Introduction to Estimation88 Questions
Exam 10: Introduction to Hypothesis Testing186 Questions
Exam 11: Inference About a Population76 Questions
Exam 12: Inference About Comparing Two Populat85 Questions
Exam 13: Inference About Comparing Two Populat85 Questions
Exam 14: Analysis of Variance127 Questions
Exam 15: Chi-Squared Tests118 Questions
Exam 16: Simple Linear Regression and Correlat238 Questions
Exam 17: Multiple Regression147 Questions
Exam 18: Review of Statistical Inference189 Questions
Select questions type
A straight line regression model with only one independent variable is called a(n)____________________-order linear model.
(Short Answer)
4.8/5  (43)
(43)
The degrees of freedom for the test statistic in a test of a contingency table is ( r - 1 )( c - 1 )where r is the number of rows in the table, and c is the number of columns.
(True/False)
4.8/5 (42)
When comparing two population variances, we use the ratio  rather than the difference
  .
.
(True/False)
4.7/5 (38)
A scatter diagram includes the following data points: 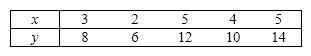 Two regression models are proposed: (1)
  , and (2)
  . Using the least squares method, which of these regression models provides the better fit to the data? Why?
(Essay)
4.8/5 (37)
If we square the t -statistic for two means, the result is the ____________________-statistic.
(Short Answer)
4.8/5 (28)
We use a t -test to determine whether two population variances are equal.
(True/False)
4.9/5 (33)
Which of the following conditions is needed regarding the chi-squared test statistic for the test of variance?
(Multiple Choice)
4.7/5 (32)
Consider a multinomial experiment involving 100 trials and 3 categories (cells). The observed frequencies resulting from the experiment are shown in the accompanying table.
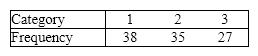 Use the 5% significance level to test the hypotheses H 0: p 1 = 0.45, p 2 = 0.30, p 3 = 0.25 vs. H 1: At least two proportions differ from their specified values.
(Essay)
4.9/5 (41)
Another name for the residual term in a regression equation is random error.
(True/False)
4.9/5 (40)
A chi-squared test is used to describe a population of nominal data.
(True/False)
4.8/5 (41)
The test statistic for the chi-squared test of a contingency table is the same as the test statistic for the goodness-of-fit test.
(True/False)
4.8/5 (38)
In the first-order linear regression model, the population parameters of the y -intercept and the slope are, respectively,
(Multiple Choice)
4.8/5 (33)
Which of the following is not an example illustrating the use of variance?
(Multiple Choice)
4.8/5 (43)
An inverse relationship between an independent variable x and a dependent variably y means that as x increases, y decreases, and vice versa.
(True/False)
4.8/5 (40)
The ____________________ adjustment used with the LSD method decreases the experimentwise Type I error rate.
(Short Answer)
4.8/5 (37)
Conducting t -tests for each pair or population means is statistically equivalent to conducting one F -test comparing all the population means.
(True/False)
4.9/5 (41)
In a test of a contingency table, rejecting the null hypothesis concludes the variables are not independent.
(True/False)
4.9/5 (48)
SSE stands for ____________________ of squares for ____________________.
(Short Answer)
4.8/5 (38)
In reference to the equation 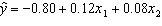 , the value 0.12 is the average change in y per unit change in x 1, when x 2 is held constant.
(True/False)
4.8/5 (42)
We use the analysis of variance (ANOVA)technique to compare two or more population means.
(True/False)
4.7/5 (34)
Filters
- Essay(0)
- Multiple Choice(0)
- Short Answer(0)
- True False(0)
- Matching(0)