Exam 18: Review of Statistical Inference
Exam 1: What Is Statistics41 Questions
Exam 2: Graphical and Tabular Descriptive Techniques199 Questions
Exam 3: Numerical Descriptive Techniques226 Questions
Exam 4: Data Collection and Sampling82 Questions
Exam 5: Probability212 Questions
Exam 6: Random Variables and Discrete Probability Distributions174 Questions
Exam 7: Continuous Probability Distributions167 Questions
Exam 8: Sampling Distributions133 Questions
Exam 9: Introduction to Estimation88 Questions
Exam 10: Introduction to Hypothesis Testing186 Questions
Exam 11: Inference About a Population76 Questions
Exam 12: Inference About Comparing Two Populat85 Questions
Exam 13: Inference About Comparing Two Populat85 Questions
Exam 14: Analysis of Variance127 Questions
Exam 15: Chi-Squared Tests118 Questions
Exam 16: Simple Linear Regression and Correlat238 Questions
Exam 17: Multiple Regression147 Questions
Exam 18: Review of Statistical Inference189 Questions
Select questions type
If each element in a population is classified into one and only one of several categories, the population is:
(Multiple Choice)
4.8/5  (45)
(45)
Before a chi-squared test of a contingency table can be carried out, the expected values of all cells should be greater than or equal to ____________________.
(Short Answer)
4.9/5 (39)
The F -test used for testing the difference in 2 population variances is always a one-tailed test.
(True/False)
4.8/5 (36)
The F- distribution is the sampling distribution of the ratio of:
(Multiple Choice)
4.8/5 (45)
If the expected frequency of a cell is less than 5, you should combine cells of the table.
(True/False)
4.7/5 (38)
In testing for the differences between the means of two independent populations where the variances in each population are unknown but assumed equal, the degrees of freedom is:
(Multiple Choice)
4.8/5 (36)
If the coefficient of correlation is 1.0, then the coefficient of determination must be 1.0.
(True/False)
4.9/5 (35)
In testing for differences between the means of two independent populations the null hypothesis is:
(Multiple Choice)
4.9/5 (44)
In multiple regression analysis, the adjusted coefficient of determination is adjusted for the number of independent variables and the sample size.
(True/False)
4.8/5 (37)
The coefficient of ____________________ measures the amount of variation in the dependent variable that is explained by the variation in the independent variable.
(Short Answer)
4.9/5 (40)
When the population standard deviation is ____________________ and the population is normal, the test statistic for testing hypotheses about m is the t -distribution with n - 1 degrees of freedom.
(Short Answer)
4.7/5 (43)
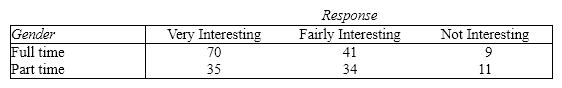
The human resources manager of a consumer product company asked a random sample of employees how they felt about the work they were doing. The following table gives a breakdown of their responses by whether the employee is part time or full time (aka work status). Do the data provide sufficient evidence to conclude that the level of job satisfaction is related to their work status? Use a = 0.10.
(Essay)
4.8/5 (29)
Based on sample data, the 90% confidence interval limits for the population mean are LCL = 170.86 and UCL = 195.42. If the 10% level of significance were used in testing the hypotheses H 0: m = 201 vs. H 1: m ¹ 201, the null hypothesis:
(Multiple Choice)
4.8/5 (36)
In simple linear regression, the denominator of the standard error of estimate s e is  .
.
(True/False)
4.9/5 (30)
The sampling distribution of  is normal if the sampled populations are normal, and approximately normal if the populations are nonnormal and the sample sizes n 1 and n 2 are large.
(True/False)
4.8/5 (33)
Two independent samples of sizes 20 and 30 are randomly selected from two normally distributed populations. Assume that the population variances are unknown but equal. In order to test the difference between the population means,  , the sampling distribution of the sample mean difference,
  , is:
, is:
(Multiple Choice)
4.9/5 (39)
In a chi-squared test of a contingency table, the value of the test statistic was c 2 = 15.652, and the critical value at a = 0.025 was 11.1433. Thus, we must reject the null hypothesis at a = 0.025.
(True/False)
4.9/5 (33)
A zero population correlation coefficient for x and y means that there is no type of relationship whatsoever between x and y.
(True/False)
4.8/5 (32)
For a multiple regression model, the total variation in y can be expressed as:
(Multiple Choice)
4.8/5 (38)
In calculating the standard error of the estimate,  , there are ( n - k - 1)degrees of freedom, where n is the sample size and k is the number of independent variables in the model.
(True/False)
4.9/5 (33)
Filters
- Essay(0)
- Multiple Choice(0)
- Short Answer(0)
- True False(0)
- Matching(0)