Exam 18: Review of Statistical Inference
Exam 1: What Is Statistics41 Questions
Exam 2: Graphical and Tabular Descriptive Techniques199 Questions
Exam 3: Numerical Descriptive Techniques226 Questions
Exam 4: Data Collection and Sampling82 Questions
Exam 5: Probability212 Questions
Exam 6: Random Variables and Discrete Probability Distributions174 Questions
Exam 7: Continuous Probability Distributions167 Questions
Exam 8: Sampling Distributions133 Questions
Exam 9: Introduction to Estimation88 Questions
Exam 10: Introduction to Hypothesis Testing186 Questions
Exam 11: Inference About a Population76 Questions
Exam 12: Inference About Comparing Two Populat85 Questions
Exam 13: Inference About Comparing Two Populat85 Questions
Exam 14: Analysis of Variance127 Questions
Exam 15: Chi-Squared Tests118 Questions
Exam 16: Simple Linear Regression and Correlat238 Questions
Exam 17: Multiple Regression147 Questions
Exam 18: Review of Statistical Inference189 Questions
Select questions type
Most statistical software print a second R 2 statistic, called the coefficient of determination adjusted for degrees of freedom, which has been adjusted to take into account the sample size and the number of independent variables.
(True/False)
4.8/5  (35)
(35)
A prediction interval is used when we want to predict a one-time occurrence for a particular value of y when the independent variable is a given x value.
(True/False)
4.8/5 (38)
In order to determine the p -value associated with hypothesis testing about the population mean m , it is necessary to know the value of the test statistic.
(True/False)
4.9/5 (31)
A confidence interval (as opposed to a prediction interval)is used to estimate the long-run average value of y .
(True/False)
4.9/5 (42)
When the objective is to compare more than two populations, the experimental design that is the counterpart of the matched pairs experiment is called a:
(Multiple Choice)
4.7/5 (42)
The adjusted coefficient of determination is adjusted for the:
(Multiple Choice)
4.9/5 (41)
In one-way analysis of variance, between-treatments variation is measured by the:
(Multiple Choice)
4.7/5 (32)
The following 10 observations of variables x and y were collected.  a. Calculate the standard error of estimate.
b. Test to determine if there is enough evidence at the 5% significance level to indicate that x and y are negatively linearly related.
c. Calculate the coefficient of correlation, and describe what this statistic tells you about the regression line.
a. Calculate the standard error of estimate.
b. Test to determine if there is enough evidence at the 5% significance level to indicate that x and y are negatively linearly related.
c. Calculate the coefficient of correlation, and describe what this statistic tells you about the regression line.
(Essay)
4.8/5 (33)
A chi-squared distribution has a shape that is ____________________.
(Short Answer)
4.8/5 (44)
The sum of squared deviations from the mean divided by the population variance has a(n)____________________ distribution with ____________________ degrees of freedom.
(Short Answer)
4.9/5 (39)
The ____________________ confidence limit of the confidence interval estimator of the population variance is  .
.
(Short Answer)
4.9/5 (31)
Motorcycle insurance appraisers examine motorcycles that have been involved in accidental collisions to assess the cost of repairs. An insurance executive is concerned that different appraisers produce significantly different assessments. In an experiment 10 motorcycles that have recently been involved in accidents were shown to two appraisers. Each assessed the estimated repair costs. These results are shown below. Can the executive conclude at the 5% significance level that the appraisers differ in their assessments? 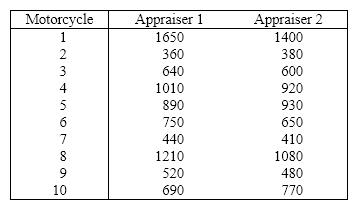
(Essay)
4.8/5 (40)
In one-way ANOVA, the test statistic is defined as the ratio of the mean square for error (MSE)and the mean square for treatments (MST), namely, F = MSE \ MST.
(True/False)
4.9/5 (33)
Multiple comparison methods are used to determine whether or not any differences occur amongst a group of population means.
(True/False)
4.8/5 (42)
The test statistic used to test hypotheses about the population variance is given by c 2 = ( n - 1)s 2 \ s 2, which is chi-squared distributed with n - 1 degrees of freedom when the population is normally distributed with variance equal to s 2 .
(True/False)
4.8/5 (47)
In a simple linear regression problem, the following statistics are calculated from a sample of 10 observations: 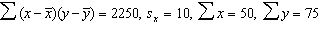 . The least squares estimates of the slope and y -intercept are, respectively,
(Multiple Choice)
4.8/5 (34)
Consider the following data values of variables x and y . 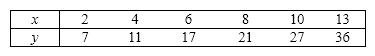 a. Determine the least squares regression line.
b. Find the predicted value of y for x = 9.
c. What does the value of the slope of the regression line tell you?
a. Determine the least squares regression line.
b. Find the predicted value of y for x = 9.
c. What does the value of the slope of the regression line tell you?
(Essay)
4.9/5 (41)
One example of a blocking variable is the dosage level that each subject is assigned to in a randomized experiment.
(True/False)
5.0/5 (34)
The t -statistic has two variables: the sample ____________________ and the sample ____________________.
(Short Answer)
4.9/5 (49)
Filters
- Essay(0)
- Multiple Choice(0)
- Short Answer(0)
- True False(0)
- Matching(0)