Exam 18: Review of Statistical Inference
Exam 1: What Is Statistics41 Questions
Exam 2: Graphical and Tabular Descriptive Techniques199 Questions
Exam 3: Numerical Descriptive Techniques226 Questions
Exam 4: Data Collection and Sampling82 Questions
Exam 5: Probability212 Questions
Exam 6: Random Variables and Discrete Probability Distributions174 Questions
Exam 7: Continuous Probability Distributions167 Questions
Exam 8: Sampling Distributions133 Questions
Exam 9: Introduction to Estimation88 Questions
Exam 10: Introduction to Hypothesis Testing186 Questions
Exam 11: Inference About a Population76 Questions
Exam 12: Inference About Comparing Two Populat85 Questions
Exam 13: Inference About Comparing Two Populat85 Questions
Exam 14: Analysis of Variance127 Questions
Exam 15: Chi-Squared Tests118 Questions
Exam 16: Simple Linear Regression and Correlat238 Questions
Exam 17: Multiple Regression147 Questions
Exam 18: Review of Statistical Inference189 Questions
Select questions type
In simple linear regression, most often we perform a two-tail test of the population slope b 1 to determine whether there is sufficient evidence to infer that a linear relationship exists. The null hypothesis is stated as:
(Multiple Choice)
4.9/5  (35)
(35)
If the regression line is horizontal, then we conclude that y ____________________ (is\is not)related to x .
(Short Answer)
5.0/5 (28)
If two events A and B are independent, the P ( A and B )= P ( A )+ P ( B ).
(True/False)
4.8/5 (35)
Five types of apples are displayed side by side in several supermarkets in the city of Miami. It was noted that in one day, 180 customers purchased apples. Of these, 30 picked type A , 40 picked type B , 25 picked type C , 35 picked type D , and 50 picked type E . In Miami, can you conclude at the 5% significance level that there is a preferred type of apples?
(Essay)
4.9/5 (36)
The symbol for the population coefficient of correlation is:
(Multiple Choice)
4.9/5 (31)
The Chairman of a committee has recently circulated pamphlets among the members, attempting to convince them that pension benefits should be the primary issue. A subsequent survey revealed the following breakdown of the members according to the plant at which they worked and the issue that they felt should be supported as the primary one.
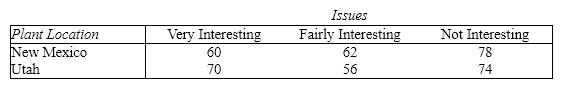 Do the data indicate at the 5% significant level that there are differences between the two plants regarding which issue should be the primary one?
(Essay)
4.8/5 (38)
In a multiple regression analysis, if the model provides a poor fit, this indicates that:
(Multiple Choice)
4.9/5 (32)
A randomized block design experiment produced the following data. 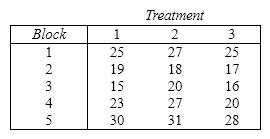 a. Set up the ANOVA Table. Use a = 0.05 to determine the critical values.
b. Test to determine whether the treatment means differ. (Use a = 0.05.)
c. Test to determine whether the block means differ. (Use a = 0.05.)
a. Set up the ANOVA Table. Use a = 0.05 to determine the critical values.
b. Test to determine whether the treatment means differ. (Use a = 0.05.)
c. Test to determine whether the block means differ. (Use a = 0.05.)
(Essay)
4.8/5 (35)
The t -test for the difference between the means of two independent populations assumes that the respective:
(Multiple Choice)
4.8/5 (34)
When testing  vs.
vs.  , the observed value of the z -score was found to be - 2.15. Then, the p -value for this test would be
(Multiple Choice)
4.8/5 (41)
Which of the following is not a characteristic of a multinomial experiment?
(Multiple Choice)
4.8/5 (45)
Two measurements from the same individuals is an example of data collected from a(n)____________________ experiment.
(Short Answer)
4.8/5 (40)
In estimating the population mean with the population standard deviation unknown, if the sample size is 16, there are 8 degrees of freedom.
(True/False)
4.9/5 (39)
The confidence interval estimate of the expected value of y for a given value x , compared to the prediction interval of y for the same given value of x and confidence level, will be:
(Multiple Choice)
4.9/5 (36)
One method of diagnosing heteroscedasticity is to plot the residuals against the predicted values of y , then look for a change in the spread of the plotted values.
(True/False)
4.8/5 (40)
A regression analysis between weight ( y in pounds)and height ( x in inches)resulted in the following least squares line:  . This implies that if the height is increased by 1 inch, the weight, on average, is expected to:
(Multiple Choice)
4.9/5 (46)
Which of the following assumptions concerning the probability distribution of the random error term is stated incorrectly?
(Multiple Choice)
4.9/5 (37)
Filters
- Essay(0)
- Multiple Choice(0)
- Short Answer(0)
- True False(0)
- Matching(0)