Exam 11: Statistically Based Quality Improvement for Variables
Exam 1: Differing Perspectives on Quality119 Questions
Exam 2: Quality Theory90 Questions
Exam 3: Global Supply Chain Quality and International Quality Standards100 Questions
Exam 4: Strategic Quality Planning91 Questions
Exam 5: The Voice of the Customer100 Questions
Exam 6: The Voice of the Market90 Questions
Exam 7: Quality and Innovation in Product and Process Design93 Questions
Exam 8: Designing Quality Services90 Questions
Exam 9: Managing Supplier Quality in the Supply Chain65 Questions
Exam 10: The Tools of Quality90 Questions
Exam 11: Statistically Based Quality Improvement for Variables105 Questions
Exam 12: Statistically Based Quality Improvement for Attributes90 Questions
Exam 13: Six Sigma Management and Lean Tools90 Questions
Exam 14: Managing Quality Improvement Teams and Projects91 Questions
Exam 15: Implementing and Validating the Quality System70 Questions
Select questions type
One hundred percent samples are also known as screening samples.
(True/False)
4.9/5  (41)
(41)
In a variables control chart, large jumps of more than three or four standard deviations result in process drift.
(True/False)
4.7/5 (40)
Use the following table to answer the question(s) below.
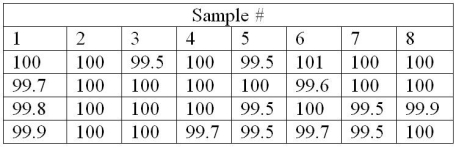 -Close tolerances are required in the manufacturing section of an automotive parts business. Since the customers demand quality, the owner wants to monitor the operation closely using statistical process control. After taking 8 samples of size 4, the owner finds himself with the data in the table above. What is the center line for a chart that will monitor process average?
(Multiple Choice)
4.8/5 (24)
Use the following table to answer the question(s) below.
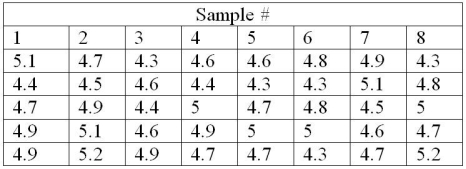 -A machine shop owner wishes to monitor the diameter of an engine boring operation where the piston bore should be 4.25". He obtains 8 samples of 5 and records the data in the table above. What should the lower and upper control limits be for an X-bar chart?
(Multiple Choice)
4.9/5 (31)
Process stability refers to the ability of a process to produce a product that meets specification.
(True/False)
4.7/5 (36)
Although charts generally are preferred for variables data, sometimes it is too time consuming or inconvenient to compute subgroup averages. In these cases, a(n) ________ is used.
(Multiple Choice)
4.8/5 (44)
Design a control chart to monitor the gas mileage in your car. Collect the data over time.
(Essay)
4.8/5 (39)
If a systematic sample is performed according to sequence, the product is inspected at regular intervals of time.
(True/False)
4.9/5 (46)
Use the following table to answer the question(s) below.
-A machine shop owner wishes to monitor the diameter of an engine boring operation where the piston bore should be 4.25". He obtains 8 samples of 5 and records the data in the table above. What should the upper and lower control limits be for an R chart?
(Multiple Choice)
4.8/5 (28)
Statistical process control charts are tools for monitoring process variation.
(True/False)
4.8/5 (29)
Process charts are graphs designed to signal process workers when nonrandom variation is occurring in a process.
(True/False)
4.9/5 (37)
The upper and lower specifications for metal head plates are 5  0.1 cm. A sample of the metal head plates in 25 undergraduates yields a mean of 5.05. We know that the population standard deviation is 0.04. What is the population capability index?
(Multiple Choice)
4.9/5 (31)
A g chart is useful when data are hypergeometrically distributed.
(True/False)
4.8/5 (31)
Consumer's risk happens when statistical quality analysis fails to result in the scrapping or reworking of a defective product.
(True/False)
4.9/5 (38)
________ are often used in monitoring the production of silicon chips for computers.
(Multiple Choice)
4.8/5 (38)
The s chart is often used where variation in a process is large.
(True/False)
4.8/5 (42)
Filters
- Essay(0)
- Multiple Choice(0)
- Short Answer(0)
- True False(0)
- Matching(0)