Exam 11: Statistically Based Quality Improvement for Variables
Exam 1: Differing Perspectives on Quality119 Questions
Exam 2: Quality Theory90 Questions
Exam 3: Global Supply Chain Quality and International Quality Standards100 Questions
Exam 4: Strategic Quality Planning91 Questions
Exam 5: The Voice of the Customer100 Questions
Exam 6: The Voice of the Market90 Questions
Exam 7: Quality and Innovation in Product and Process Design93 Questions
Exam 8: Designing Quality Services90 Questions
Exam 9: Managing Supplier Quality in the Supply Chain65 Questions
Exam 10: The Tools of Quality90 Questions
Exam 11: Statistically Based Quality Improvement for Variables105 Questions
Exam 12: Statistically Based Quality Improvement for Attributes90 Questions
Exam 13: Six Sigma Management and Lean Tools90 Questions
Exam 14: Managing Quality Improvement Teams and Projects91 Questions
Exam 15: Implementing and Validating the Quality System70 Questions
Select questions type
A(n) ________ is an either-or-situation resulting from a binomial process.
(Multiple Choice)
4.8/5  (35)
(35)
Samples can be ________ according to time or according to sequence.
(Multiple Choice)
4.7/5 (28)
Producer's risk is the probability that a nonconforming product will be available for sale.
(True/False)
4.9/5 (34)
The ________ is often used where variation in a process is small.
(Multiple Choice)
4.7/5 (27)
Process stability means that the variation we observe in the process is ________ variation.
(Multiple Choice)
4.7/5 (37)
Random variation results from an event such as a shift in a process mean or some unexpected occurrence.
(True/False)
4.9/5 (23)
An attribute is a continuous measurement such as weight, height, or volume.
(True/False)
4.8/5 (36)
The cusum chart is used for monitoring variables and measurement on a continuous scale.
(True/False)
4.8/5 (30)
A process is capable if only common variation is present in the process.
(True/False)
4.8/5 (34)
Use the following table to answer the question(s) below.
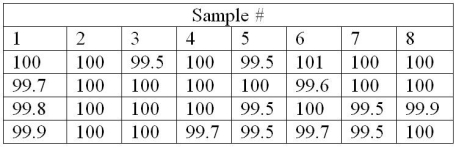 -Close tolerances are required in the manufacturing section of an automotive parts business. Since the customers demand quality, the owner wants to monitor the operation closely using statistical process control. After taking 8 samples of size 4, the owner finds himself with the data in the table above. What are the lower and upper limits for a chart that will monitor process average?
(Multiple Choice)
4.8/5 (38)
What is the first step in developing process control charts?
(Multiple Choice)
4.8/5 (32)
Which of the following is an example of an attributes chart?
(Multiple Choice)
4.7/5 (38)
________ happens when statistical quality analysis fails to result in the scrapping or reworking of a defective product.
(Multiple Choice)
4.8/5 (29)
Use the following table to answer the question(s) below.
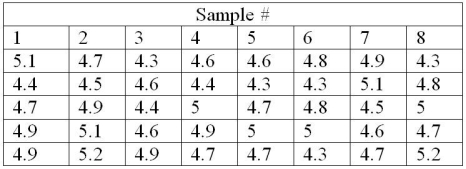 -A machine shop owner wishes to monitor the diameter of an engine boring operation where the piston bore should be 4.25". He obtains 8 samples of 5 and records the data in the table above. What should the center line be for a chart that monitors process dispersion?
(Multiple Choice)
4.8/5 (42)
The R chart is a process chart used to monitor the average of the characteristic being measured.
(True/False)
4.9/5 (33)
Use the following table to answer the question(s) below.
-Close tolerances are required in the manufacturing section of an automotive parts business. Since the customers demand quality, the owner wants to monitor the operation closely using statistical process control. After taking 8 samples of size 4, the owner finds himself with the data in the table above. What is the center line for a chart that will monitor process dispersion?
(Multiple Choice)
4.8/5 (30)
The ________ chart is used in monitoring process dispersion.
(Multiple Choice)
4.9/5 (32)
Variation within the data in a ________ subgroup can provide a yardstick for computing limits on the standard variation between subgroups.
(Multiple Choice)
4.8/5 (35)
The lower limit of R is zero for sample sizes less than or equal to six.
(True/False)
4.9/5 (31)
Filters
- Essay(0)
- Multiple Choice(0)
- Short Answer(0)
- True False(0)
- Matching(0)