Exam 3: Interdependence and the Gains From Trade
Exam 1: Ten Principles of Economics237 Questions
Exam 2: Thinking Like an Economist267 Questions
Exam 3: Interdependence and the Gains From Trade217 Questions
Exam 4: The Market Forces of Supply and Demand303 Questions
Exam 5: Elasticity and Its Applications282 Questions
Exam 6: Supply, demand, and Government Policies252 Questions
Exam 7: Consumers, producers, and the Efficiency of Markets248 Questions
Exam 8: Application: the Costs of Taxation245 Questions
Exam 9: Application: International Trade245 Questions
Exam 10: Externalities288 Questions
Exam 11: Public Goods and Common Resources258 Questions
Exam 12: The Design of the Tax System328 Questions
Exam 13: The Costs of Production303 Questions
Exam 14: Firms in Competitive Markets271 Questions
Exam 15: Monopoly306 Questions
Exam 16: Oligopoly291 Questions
Exam 17: Monopolistic Competition257 Questions
Exam 18: The Markets for the Factors of Production284 Questions
Exam 19: Earnings and Discrimination286 Questions
Exam 20: Income Inequality and Poverty247 Questions
Exam 21: The Theory of Consumer Choice238 Questions
Exam 22: Frontiers of Microeconomics199 Questions
Exam 23: Measuring a Nations Income215 Questions
Exam 24: Measuring the Cost of Living208 Questions
Exam 25: Production and Growth240 Questions
Exam 26: Saving, investment, and the Financial System282 Questions
Exam 27: The Basic Tools of Finance249 Questions
Exam 28: Unemployment242 Questions
Exam 29: The Monetary System277 Questions
Exam 30: Money Growth and Inflation224 Questions
Exam 31: Open-Economy Macroeconomics: Basic Concepts256 Questions
Exam 32: A Macroeconomic Theory of the Open Economy217 Questions
Exam 33: Aggregate Demand and Aggregate Supply302 Questions
Exam 34: The Influence of Monetary and Fiscal Policy on Aggregate Demand249 Questions
Exam 35: The Short Run Trade Off Between Inflation and Unemployment246 Questions
Exam 36: Five Debates Over Macroeconomic Policy140 Questions
Select questions type
Figure 3-1
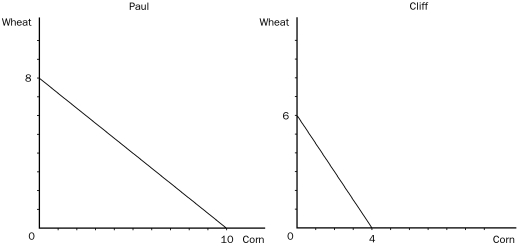 -Refer to Figure 3-1.The opportunity cost of 1 bushel of corn is
(Multiple Choice)
4.7/5  (34)
(34)
Table 3-5
 -Refer to Table 3-5.If Japan and the United States trade based on the principle of comparative advantage,
(Multiple Choice)
4.8/5 (26)
Figure 3-5 The graph below represents the various combinations of cars and corn that Country A could produce in a given month. (On the vertical axis, corn is measured in bushels.)
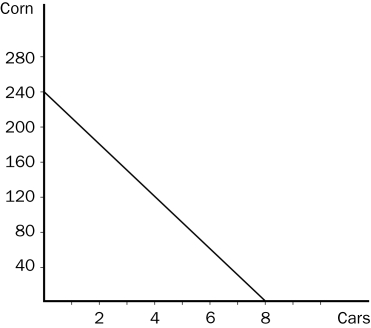 -Refer to Figure 3-5.The fact that the line slopes downward reflects the fact that
(Multiple Choice)
4.7/5 (36)
Table 3-1
 -Refer to Table 3-1.The opportunity cost of 1 pound of potatoes for the rancher is
(Multiple Choice)
4.9/5 (43)
These figures illustrate the production possibilities available to Barney and Betty with 8 hours of labor in their baker
Figure 3-4
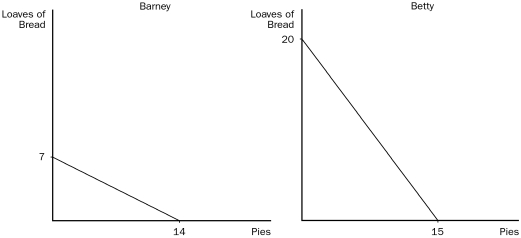 -Refer to Figure 3-4.The opportunity cost of 1 loaf of bread for Barney is
(Multiple Choice)
4.9/5 (39)
Table 3-3
 -Refer to Table 3-3.The opportunity cost of 1 basket for Missouri is
(Multiple Choice)
4.8/5 (41)
Recently,it has been suggested by researchers that the theory of comparative advantage may explain the fact that
(Multiple Choice)
4.9/5 (47)
International trade may make some individuals in a nation better off,while other individuals are made worse off.
(True/False)
4.8/5 (44)
A country's consumption possibilities frontier can be outside its production possibilities frontier if
(Multiple Choice)
4.8/5 (34)
Travis can mow a lawn in two hours or he can trim a tree in one hour.Ricardo can mow a lawn in three hours or he can trim a tree in two hours.
(Multiple Choice)
4.9/5 (36)
Figure 3-1
-Refer to Figure 3-1.Which of the following statements is correct?
(Multiple Choice)
4.8/5 (26)
For the following question(s), use the accompanying table.
Table 3-2
 -Refer to Table 3-2.For Carolyn,the opportunity cost of 1 dress is
(Multiple Choice)
4.8/5 (34)
Table 3-4
Brenda and Eric run a business that involves setting up and testing computers. The following table applies.
 -Refer to Table 3-4.Which of these points would not be on Brenda's production possibilities frontier,based on a 40-hour week and assuming Brenda can switch between setting up and testing computers at a constant rate?
(Multiple Choice)
4.8/5 (30)
Figure 3-5 The graph below represents the various combinations of cars and corn that Country A could produce in a given month. (On the vertical axis, corn is measured in bushels.)
-Refer to Figure 3-5.The graph that is shown is called a
(Multiple Choice)
4.8/5 (36)
Table 3-3
-Refer to Table 3-3.If Montana and Missouri trade based on the principle of comparative advantage,Montana will export
(Multiple Choice)
4.8/5 (35)
Use the accompanying table to answer the following questions:
Table 3-6
 -Refer to Table 3-6.The opportunity cost of 1 unit of bread in England is
(Multiple Choice)
5.0/5 (43)
Figure 3-1
-Refer to Figure 3-1.Suppose Cliff must work 5 hours to produce each bushel of corn.Then Cliff's production possibilities frontier is based on how many hours of work?
(Multiple Choice)
4.8/5 (30)
Jonathan can make a bird house in 3 hours.He can make a bird feeder in 1 hour.The opportunity cost to Jonathan of making a bird house is 1/3 bird feeder.
(True/False)
5.0/5 (37)
Filters
- Essay(0)
- Multiple Choice(0)
- Short Answer(0)
- True False(0)
- Matching(0)