Exam 13: Additional Topics in Regression Analysis
Exam 1: Describing Data: Graphical247 Questions
Exam 2: Describing Data: Numerical326 Questions
Exam 3: Probability345 Questions
Exam 4: Discrete Random Variables and Probability Distributions257 Questions
Exam 5: Continuous Random Variables and Probability Distributions239 Questions
Exam 6: Sampling and Sampling Distributions147 Questions
Exam 7: Estimation: Single Population151 Questions
Exam 8: Estimation: Additional Topics109 Questions
Exam 9: Hypothesis Testing: Single Population164 Questions
Exam 10: Hypothesis Testing: Additional Topics103 Questions
Exam 11: Simple Regression217 Questions
Exam 12: Multiple Regression252 Questions
Exam 13: Additional Topics in Regression Analysis168 Questions
Exam 14: Analysis of Categorical Data241 Questions
Exam 15: Analysis of Variance192 Questions
Exam 16: Time-Series Analysis and Forecasting138 Questions
Exam 17: Additional Topics in Sampling110 Questions
Select questions type
THE NEXT QUESTIONS ARE BASED ON THE FOLLOWING INFORMATION:
A market researcher is interested in the average amount of money spent per year by college students on clothing.From 25 years of annual data,the following estimated regression was obtained through least squares:
yt = 48.75 +  +
+  +
+  where the numbers in parentheses below the coefficients are the coefficient standard errors,and
y = Expenditure per student,in dollars,on clothes
x1 = Disposable income per student,in dollars,after the payment of tuition,fees,and room and board.
x2 = Index of advertising,aimed at the student market,on clothes
-Briefly discuss what is meant by the "dummy variable trap".
where the numbers in parentheses below the coefficients are the coefficient standard errors,and
y = Expenditure per student,in dollars,on clothes
x1 = Disposable income per student,in dollars,after the payment of tuition,fees,and room and board.
x2 = Index of advertising,aimed at the student market,on clothes
-Briefly discuss what is meant by the "dummy variable trap".
(Essay)
4.9/5  (37)
(37)
THE NEXT QUESTIONS ARE BASED ON THE FOLLOWING INFORMATION:
An economist is in the process of developing a model to predict the price of gold.She believes that the two most important variables are the price of a barrel of oil (x1)and the interest rate (x2).She proposes the model y = β0 + β1x1 + β2x2 + β3x1x3 + ε.A random sample of 20 daily observations was taken.The computer output is shown below.
THE REGRESSION EQUATION IS
y = 115.6 + 22.3x1 + 14.7x2 - 1.36x1x2
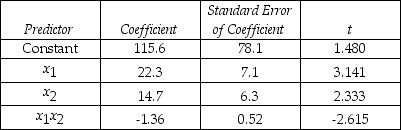 S = 20.9 R-Sq = 55.4%
ANALYSIS OF VARIANCE
S = 20.9 R-Sq = 55.4%
ANALYSIS OF VARIANCE
 -Suppose that the true linear model for a process was Y = β0 + β1X1 + β2X2 + β3X3 and you incorrectly estimated the model y = α + α1X2.Discuss the bias that results from using the second model.
(Essay)
4.9/5 (30)
Kurt is trying to regress a model that studies market prices between similar products from different companies.During his study he realized that one of the independent variables,the competitor's price,was causing multicollinearity issues with the model.If Kurt removes the variable from the model,which of the following statistical phenomenon could affect Kurt's model?
(Multiple Choice)
5.0/5 (37)
The model yt = 8 + 2.1xt + 0.25yt-1 is estimated using regression analysis applied to time-series data.What is the effect of a 1-unit increase in x in period (t + 1)?
(Essay)
4.8/5 (42)
Consider the following model: Yt = β0 + β1x1t + β2x2t + β33x3t + γ4Yt-1.Suppose we increase X1 by one unit in time period t with all other independent variables in the model held fixed.What is the total expected increase in the dependent variable over all current and future time periods?
(Short Answer)
4.8/5 (36)
In a regression model such as y = β0 + β1X1 + β2X2 + ε,if changes in x1 and x2 happen simultaneously,the model is said to be affected by:
(Multiple Choice)
4.7/5 (30)
When measuring experimental outcomes,a(n)________ variable represents a variable whose effect is crucial in estimating using minimum variance.
(Multiple Choice)
4.8/5 (45)
Which of the following is true of the value of the Durbin-Watson statistic,d,when there is positive correlation?
(Multiple Choice)
4.8/5 (27)
Write the model specification and define the variables for a multiple regression model to predict earnings as a function of age and level of education: high school graduate,college graduate,master degree or doctorate degree.
(Essay)
4.7/5 (45)
THE NEXT QUESTIONS ARE BASED ON THE FOLLOWING INFORMATION:
A market researcher is interested in the average amount of money spent per year by college students on clothing.From 25 years of annual data,the following estimated regression was obtained through least squares:
yt = 48.75 +
+
+
where the numbers in parentheses below the coefficients are the coefficient standard errors,and
y = Expenditure per student,in dollars,on clothes
x1 = Disposable income per student,in dollars,after the payment of tuition,fees,and room and board.
x2 = Index of advertising,aimed at the student market,on clothes
-With advertising held fixed,what would be the expected impact over time of a $1 increase in disposable income per student on clothing expenditure?
(Essay)
5.0/5 (39)
THE NEXT QUESTIONS ARE BASED ON THE FOLLOWING INFORMATION:
A market researcher is interested in the average amount of money spent per year by college students on clothing.From 25 years of annual data,the following estimated regression was obtained through least squares:
yt = 48.75 +
+
+
where the numbers in parentheses below the coefficients are the coefficient standard errors,and
y = Expenditure per student,in dollars,on clothes
x1 = Disposable income per student,in dollars,after the payment of tuition,fees,and room and board.
x2 = Index of advertising,aimed at the student market,on clothes
-Test the hypotheses: H0 : There is no first-order autocorrelation vs.H1 : There is negative first-order autocorrelation given that: Durbin-Watson Statistic d = 1.75,n = 20,k = 2,and α = 0.01.
(Essay)
4.8/5 (33)
If the Durbin-Watson statistic has a value close to 0 or 4,which assumption is violated?
(Multiple Choice)
4.8/5 (32)
Explain what is meant by autocorrelated errors.What effects does autocorrelation have on the results of a regression?
(Essay)
4.7/5 (31)
What does the following plot of residuals from a regression analysis suggest? 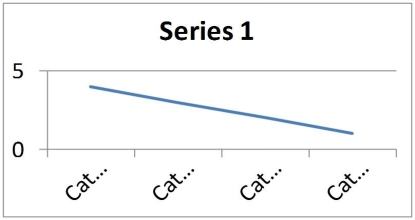
(Multiple Choice)
4.8/5 (36)
The estimated standard deviation of the slope coefficients is influenced directly by the spread of the independent variables and the correlations between independent variables.
(True/False)
4.9/5 (36)
If the Durbin-Watson statistic,d,is found to be 2,which of the following would be considered true?
(Multiple Choice)
4.9/5 (26)
The model yt = 12 + 2.4xt + 0.5yt-1 is estimated using regression analysis applied to time-series data.What is the effect of a 1-unit increase in x in period (t + 2)?
(Essay)
4.9/5 (33)
The coefficients can be easily estimated if the independent variables are perfectly correlated.
(True/False)
5.0/5 (36)
Suppose that the estimated regression equation of a College of Business graduates is given by:  = 32,000 + 4,000x + 1,800D,where y is the starting salary,x is the grade point average and D is a dummy variable which takes the value of 1 if the student is a finance major and 0 if not.An accountancy major graduate with a 3.5 grade point average would have an average starting salary of:
(Multiple Choice)
4.8/5 (42)
Which of the following is the similarity between how heteroscedasticity and autocorrelations occur?
(Multiple Choice)
4.7/5 (37)
Filters
- Essay(0)
- Multiple Choice(0)
- Short Answer(0)
- True False(0)
- Matching(0)