Exam 13: Additional Topics in Regression Analysis
Exam 1: Describing Data: Graphical247 Questions
Exam 2: Describing Data: Numerical326 Questions
Exam 3: Probability345 Questions
Exam 4: Discrete Random Variables and Probability Distributions257 Questions
Exam 5: Continuous Random Variables and Probability Distributions239 Questions
Exam 6: Sampling and Sampling Distributions147 Questions
Exam 7: Estimation: Single Population151 Questions
Exam 8: Estimation: Additional Topics109 Questions
Exam 9: Hypothesis Testing: Single Population164 Questions
Exam 10: Hypothesis Testing: Additional Topics103 Questions
Exam 11: Simple Regression217 Questions
Exam 12: Multiple Regression252 Questions
Exam 13: Additional Topics in Regression Analysis168 Questions
Exam 14: Analysis of Categorical Data241 Questions
Exam 15: Analysis of Variance192 Questions
Exam 16: Time-Series Analysis and Forecasting138 Questions
Exam 17: Additional Topics in Sampling110 Questions
Select questions type
If the Durbin-Watson statistic d has values between 0 and dL,this indicates:
(Multiple Choice)
4.7/5  (43)
(43)
Briefly discuss approaches that can be employed in situations where multicollinearity is detected.
(Essay)
4.9/5 (38)
THE NEXT QUESTIONS ARE BASED ON THE FOLLOWING INFORMATION:
Consider the following model: Y = β0 + β1X1t + β2X2t + γYt-1.Suppose we increase X1 by one unit in time period t,with all other independent variables in the model held fixed.
-What is the expected increase in the dependent variable in time period (t + 2)?
(Multiple Choice)
4.9/5 (38)
THE NEXT QUESTIONS ARE BASED ON THE FOLLOWING INFORMATION:
An economist is in the process of developing a model to predict the price of gold.She believes that the two most important variables are the price of a barrel of oil (x1)and the interest rate (x2).She proposes the model y = β0 + β1x1 + β2x2 + β3x1x3 + ε.A random sample of 20 daily observations was taken.The computer output is shown below.
THE REGRESSION EQUATION IS
y = 115.6 + 22.3x1 + 14.7x2 - 1.36x1x2
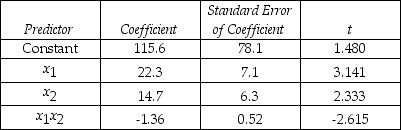 S = 20.9 R-Sq = 55.4%
ANALYSIS OF VARIANCE
S = 20.9 R-Sq = 55.4%
ANALYSIS OF VARIANCE
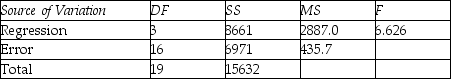 -Do these results allow us,at the 5% significance level,to conclude that the model is useful in predicting the price of gold?
(Essay)
4.9/5 (37)
Consider the following plot of residuals from a regression.This pattern suggests which of the following problems? 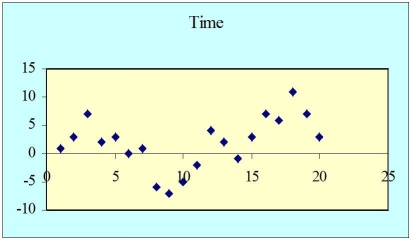
(Multiple Choice)
4.8/5 (41)
THE NEXT QUESTIONS ARE BASED ON THE FOLLOWING INFORMATION:
An economist is in the process of developing a model to predict the price of gold.She believes that the two most important variables are the price of a barrel of oil (x1)and the interest rate (x2).She proposes the model y = β0 + β1x1 + β2x2 + β3x1x3 + ε.A random sample of 20 daily observations was taken.The computer output is shown below.
THE REGRESSION EQUATION IS
y = 115.6 + 22.3x1 + 14.7x2 - 1.36x1x2
S = 20.9 R-Sq = 55.4%
ANALYSIS OF VARIANCE
-In the regression model Y = β0 + β2X1 + β2X2 + ε,the extent of any multicollinearity can be evaluated by finding the correlation between X2 and X2 in the sample.Explain why this is so.
(Essay)
4.9/5 (38)
THE NEXT QUESTIONS ARE BASED ON THE FOLLOWING INFORMATION:
Consider the following data for two variables,x and y.The independent variable x represents the amount of training time (in hours)for a salesperson starting a new car dealership to adjust fully,and the dependent variable y represents the weekly sales (in $1000s).
 -Develop an estimated regression equation of the form
  = b0 + b1x using statistical software.
(Essay)
4.7/5 (36)
Write the model specification and define the variables for a multiple regression model to predict wages in U.S.dollars as a function of years of experience and country of employment,indicated as Austria,France,Germany,Japan,and United States.
(Essay)
4.8/5 (40)
Filters
- Essay(0)
- Multiple Choice(0)
- Short Answer(0)
- True False(0)
- Matching(0)