Exam 17: Multiple Regression
Exam 1: What Is Statistics46 Questions
Exam 2: Graphical Descriptive Techniques 194 Questions
Exam 3: Graphical Descriptive Techniques 2156 Questions
Exam 4: Numerical Descriptive Techniques275 Questions
Exam 5: Data Collection and Sampling84 Questions
Exam 6: Probability240 Questions
Exam 7: Random Variables and Discrete Probability Distributions283 Questions
Exam 8: Continuous Probability Distributions224 Questions
Exam 9: Sampling Distributions156 Questions
Exam 10: Introduction to Estimation154 Questions
Exam 11: Introduction to Hypothesis Testing189 Questions
Exam 12: Inference About a Population153 Questions
Exam 13: Inference About Comparing Two Populations170 Questions
Exam 14: Analysis of Variance157 Questions
Exam 15: Chi-Squared Tests179 Questions
Exam 16: Simple Linear Regression and Correlation304 Questions
Exam 17: Multiple Regression160 Questions
Exam 18: Model Building148 Questions
Exam 19: Nonparametric Statistics175 Questions
Exam 20: Time-Series Analytics and Forecasting225 Questions
Exam 21: Statistical Process Control140 Questions
Exam 22: Decision Analysis123 Questions
Exam 23: Conclusion47 Questions
Select questions type
For a multiple regression model the following statistics are given: Total variation in y = 250,SSE = 50,k = 4,and n = 20.Then,the coefficient of determination adjusted for the degrees of freedom is:
(Multiple Choice)
4.8/5  (30)
(30)
To use the Durbin-Watson test to test for negative first-order autocorrelation,the null hypothesis will be H0: ____________________ (there is/there is no)first-order autocorrelation.
(Short Answer)
4.8/5 (38)
In a multiple regression analysis,if the model provides a poor fit,this indicates that:
(Multiple Choice)
4.8/5 (32)
A high value of the coefficient of determination significantly above 0 in multiple regression,accompanied by insignificant t-statistics on all parameter estimates,very often indicates a high correlation between independent variables in the model.
(True/False)
4.9/5 (42)
In testing the significance of a multiple regression model with three independent variables,the null hypothesis is 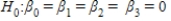 .
.
(True/False)
4.9/5 (35)
A multiple regression model has the form 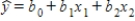 .The coefficient b1 is interpreted as the average change in y per unit change in x1.
(True/False)
4.8/5 (32)
There are several clues to the presence of multicollinearity.One clue is when an independent variable is added or deleted,the regression coefficients for the other variables ____________________.
(Short Answer)
4.8/5 (43)
Consider the following statistics of a multiple regression model: n = 25,k = 5,b1 = −6.31,and sε = 2.98.Can we conclude at the 1% significance level that x1 and y are linearly related?
(Essay)
4.8/5 (30)
Real Estate Builder
A real estate builder wishes to determine how house size is influenced by family income,family size,and education of the head of household.House size is measured in hundreds of square feet,income is measured in thousands of dollars,and education is measured in years.A partial computer output is shown below. SUMMARY OUTPUT Regression Statistics Multiple R 0.865 R Square 0.748 Adjusted R Square 0.726 Standard Error 5.195 Observations 50 ANOVA 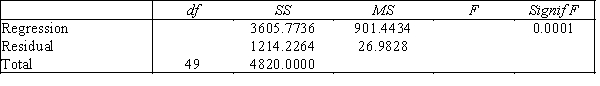
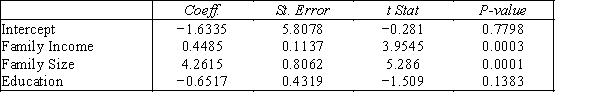
-{Real Estate Builder Narrative} Suppose the builder wants to test whether the coefficient on education is significantly different from 0.What is the value of the relevant t-statistic?
-{Real Estate Builder Narrative} Suppose the builder wants to test whether the coefficient on education is significantly different from 0.What is the value of the relevant t-statistic?
(Short Answer)
4.8/5 (31)
There are several clues to the presence of multicollinearity.One clue is when a regression coefficient exhibits the wrong ____________________.
(Short Answer)
4.9/5 (28)
Small values of the Durbin-Watson statistic d (d < 2)indicate a negative first-order autocorrelation.
(True/False)
4.9/5 (31)
In regression analysis,the total variation in the dependent variable y,measured by  ,can be decomposed into two parts: the explained variation,measured by SSR,and the unexplained variation,measured by SSE.
(True/False)
4.8/5 (24)
In a multiple regression model,the error variable ε is assumed to have a mean of:
(Multiple Choice)
4.9/5 (36)
If multicollinearity exists among the independent variables included in a multiple regression model,then:
(Multiple Choice)
4.8/5 (32)
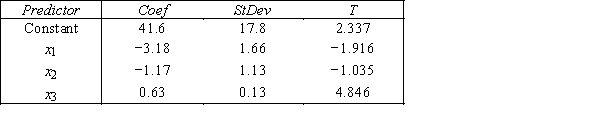
Student's Final Grade
A statistics professor investigated some of the factors that affect an individual student's final grade in her course.She proposed the multiple regression model 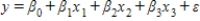 ,where y is the final grade (out of 100 points),x1 is the number of lectures skipped,x2 is the number of late assignments,and x3 is the midterm exam score (out of 100).The professor recorded the data for 50 randomly selected students.The computer output is shown below. THE REGRESSION EQUATION IS
 S = 13.74 R−Sq = 30.0% ANALYSIS OF VARIANCE
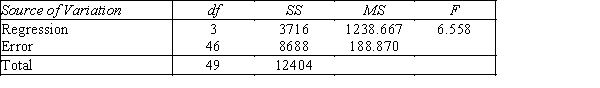
-{Student's Final Grade Narrative} What is the adjusted coefficient of determination? What does this statistic tell you?
-{Student's Final Grade Narrative} What is the adjusted coefficient of determination? What does this statistic tell you?
(Essay)
4.7/5 (30)
A multiple regression equation includes 5 independent variables,and the coefficient of determination is 0.81.The percentage of the variation in y that is explained by the regression equation is:
(Multiple Choice)
4.8/5 (35)
In reference to the equation  ,the value −0.80 is the y-intercept.
(True/False)
4.9/5 (34)
Multicollinearity will result in excessively low standard errors of the parameter estimates reported in the regression output.
(True/False)
4.9/5 (39)
A multiple regression model has the form  .As x3 increases by one unit,with x1 and x2 held constant,the y on average is expected to:
(Multiple Choice)
4.9/5 (41)
Some of the requirements for the error variable in a multiple regression model are that the standard deviation is a(n)____________________ and the errors are ____________________.
(Short Answer)
4.8/5 (45)
Filters
- Essay(0)
- Multiple Choice(0)
- Short Answer(0)
- True False(0)
- Matching(0)